1. INTRODUCTION
For over a decade, marketing educators have debated the gap between university curricula and the skills required by industry, with research indicating a need to shift focus from knowledge demonstration to skills acquisition (Rundle-Thiele et al., 2005) . This challenge remains critical today, particularly as marketing students continue to demonstrate deficiencies in the quantitative skills that are increasingly in demand (Muniz et al., 2021).
In an increasingly data-driven world, the demand for data literacy and applied statistical reasoning across various disciplines has never been more critical. Modern curricula in statistics and data science education are continually challenged to move beyond theoretical concepts, equipping students with the practical skills necessary to analyze real-world data and translate complex findings into actionable insights (Garfield & Ben-Zvi, 2008). A key strategy to enhance student engagement and deepen understanding in this context is the integration of authentic, unrefined datasets that mirror the complexities encountered in professional settings (Hardin et al., 2015; Neumann et al., 2013). Such real-world applications provide a tangible link between abstract statistical methodologies and their direct relevance to business and societal challenges, fostering a more dynamic and experiential learning environment.
Customer segmentation stands as a cornerstone of modern marketing analytics, offering a powerful lens through which to understand diverse consumer behaviors and tailor strategic interventions. Among the various methodologies, the Recency-Frequency-Monetary (RFM) model has long been recognized for its parsimony, intuitive interpretability, and low data requirements (Hughes, 1994; Rahim et al., 2021). RFM assesses customer activity across three behavioral dimensions: recency (time since last purchase), frequency (purchase repetition), and monetary value (spending intensity). Its appeal lies not only in its simplicity and effectiveness for customer relationship management in transactional contexts but also in its inherent pedagogical value. Students can readily relate to these dimensions from their own consumption habits, making the model an accessible entry point into applied data analysis.
Complementing the RFM framework, unsupervised learning techniques such as K-Means clustering and Principal Component Analysis (PCA) serve as fundamental tools for identifying natural groupings within data and simplifying multivariate structures for visualization (Han et al., 2011; James et al., 2021). While K-Means effectively segments customers based on their RFM profiles, PCA offers a powerful method for reducing the dimensionality of these metrics, enabling clearer visual representation and facilitating the interpretation of cluster boundaries. The integration of these techniques provides a comprehensive pedagogical pipeline, allowing students to explore concepts of data distribution, distance-based clustering, and dimensionality reduction in a practical and engaging manner.
Despite its classical foundation, the RFM model has evolved to address limitations, such as its temporal myopia, by incorporating enhancements like the time interval for a more dynamic understanding of purchasing behavior (Reinartz & Kumar, 2003; Tsai & Chiu, 2004). Furthermore, advancements in machine learning and fuzzy logic have expanded its predictive power and semantic interpretability (Martínez et al., 2021; Mena et al., 2024). These developments underscore the RFM framework’s adaptability and its continued relevance in contemporary data analytics, making it an ideal candidate for demonstrating the evolution and application of statistical models in an educational setting.
In an increasingly data-driven world, the modern marketing curriculum is continually challenged to move beyond theoretical concepts, equipping students with the practical analytical skills necessary to translate complex customer data into actionable business strategies (Finch et al., 2013). Marketing curricula are continually challenged to equip students with practical analytical skills, especially since marketing students generally demonstrate a deficiency in the quantitative side of the discipline (Muniz et al., 2021).
Therefore, this article aims to demonstrate how an RFM-based customer segmentation, applied to a real-world transactional dataset from a Brazilian bakery, can serve as a powerful pedagogical tool. Our objective is twofold: (i) to present a robust methodology for segmenting customers based on RFM metrics, and (ii) to articulate a comprehensive framework for transforming this analytical process into an interactive and impactful learning experience for students in data science and statistics education. By doing so, we seek to cultivate data-literate decision-makers capable of navigating the complexities of real-world data and communicating data-driven insights effectively.
2. DATASET AND EDUCATIONAL SETTING
This section provides a detailed overview of the real-world dataset employed in this study and elaborates on the pedagogical context in which the proposed RFM-based segmentation framework can be utilized. The aim is to bridge empirical analysis with its instructional utility, setting the stage for an applied learning experience in data science education.
2.1. DATASET DESCRIPTION
The analysis presented in this paper is based on a real-world transactional dataset, specifically from a Brazilian bakery, sourced through a technology company specializing in loyalty program systems. This comprehensive dataset contains operations from January 1, 2025 to April 21, 2025, and includes over 189,000 transactional records. The complete dataset is available in the supplementary materials. The raw data consists of several key variables essential for understanding customer behavior:
-
SaleID: This unique identifier represents a single shopping cart or transaction. When a customer purchases multiple products within the same visit, the SaleID is repeated across all items belonging to that specific purchase. This variable is crucial for delineating individual transaction baskets.
-
CustomerID: This numeric code uniquely identifies a fidelized (loyal) customer within the company’s loyalty program. These are customers who have completed a registration process, thereby associating them with a unique and traceable identification number. However, a significant aspect of this variable is that non-fidelized or unidentified customers are uniformly assigned a CustomerID value of 0. This implies that CustomerID = 0 does not represent a single entity but rather an aggregate of numerous distinct, non-identifiable consumers.
-
CardNumber: This variable offers insights similar to CustomerID regarding customer identification, also utilizing 0 for non-identified users. Its analysis often mirrors that of CustomerID in terms of customer uniqueness.
-
Quantity: This field denotes the quantity of a product purchased within a transaction. Its unit (e.g., weight, volume, or count) is context-dependent, varying by product type.
-
ItemValue: Represents the monetary value of a specific product item within a given transaction, expressed in Brazilian Reais (BRL). It reflects the direct price of the product sold, not a unit price (e.g., per kilogram or liter).
-
SaleDate: Captures the date and exact time of each sales transaction, which is fundamental for computing recency metrics.
-
ProductID: A unique identifier for each distinct product.
-
ItemDescription: Provides a descriptive name for the purchased product or service, with descriptions provided in Portuguese. This variable enables detailed product-level analysis.
For the purpose of the RFM segmentation presented in this study, the analysis specifically focused on identified and fidelized customers. Consequently, all transactional records associated with CustomerID = 0 (representing non-identified customers) were systematically excluded from the dataset prior to computing RFM metrics. This pre-processing step ensures that the customer segmentation accurately reflects the behavior of trackable, individual consumers, aligning with the core objective of understanding and targeting distinct customer profiles.
2.2. EDUCATIONAL SETTING
The application of the RFM framework with this real-world retail dataset provides a rich pedagogical opportunity within various educational settings. The model’s intuitive interpretability and direct applicability to consumer behavior, drawing parallels to students’ own consumption habits, make it pedagogically accessible.
This module is primarily designed for students enrolled in applied data science, marketing analytics, or advanced statistics courses, typically at the undergraduate or graduate level. The instructional objectives extend beyond mere statistical computation, aiming to cultivate critical thinking, data interpretation, and the ability to translate analytical findings into actionable business strategies.
The educational process can be structured as a modular, inquiry-based classroom activity. Key aspects of its application include:
-
Learning Objectives: Students will gain hands-on experience in unsupervised learning, including data pre-processing (e.g., handling missing values, managing specific data characteristics like CustomerID = 0, applying transformations like logarithm and standardization), model validation (using methods like the Elbow Method and Silhouette Score), and the critical interpretation of clustering results.
-
Instructor’s Role: The instructor acts as a facilitator, guiding students through the analytical pipeline. This involves challenging students to justify methodological choices (e.g., selection of optimal number of clusters, handling of outliers), prompting discussions on the business implications of different customer segments, and encouraging them to propose data-driven interventions.
-
Active Learning through Case Studies: Each identified customer cluster can serve as a mini case study. Students can be tasked with simulating real-world marketing analyst roles, designing specific campaign strategies (e.g., retention, reactivation, upselling) tailored to each segment’s profile. This promotes decision-making under uncertainty and integrates domain knowledge with statistical reasoning.
-
Bridging to Advanced Topics: The RFM segmentation provides a natural stepping stone to more complex analytical techniques, such as predictive modeling (e.g., churn prediction), basket analysis, or time-series forecasting of customer behavior. This also offers opportunities to explore how different analytical perspectives (e.g., customer-centric vs. product-centric analyses) can be integrated for a more holistic understanding of business operations.
This setting emphasizes experiential learning, allowing students to engage directly with real-world data challenges and develop the competencies required for data-driven decision-making in various professional contexts.
3. RFM-BASED SEGMENTATION
The RFM framework, based on Recency, Frequency, and Monetary value, has long been used in marketing analytics for customer segmentation. Originally introduced by Hughes (1994) and later refined by Fader et al. (2005), it offers a simple yet powerful lens through which to understand consumer behavior. In an educational context, this model is exceptionally appealing due to its intuitive interpretability and applicability to real-world data. This model was applied to a real-world transactional dataset from a Brazilian retail company. Its three axes offer students a direct mapping to behavioral traits: how recently a customer made a purchase (Recency), how often they purchase (Frequency), and how much they spend (Monetary). These traits are inherently familiar to students from their own consumption habits, making the model pedagogically accessible.
3.1. THEORETICAL JUSTIFICATION
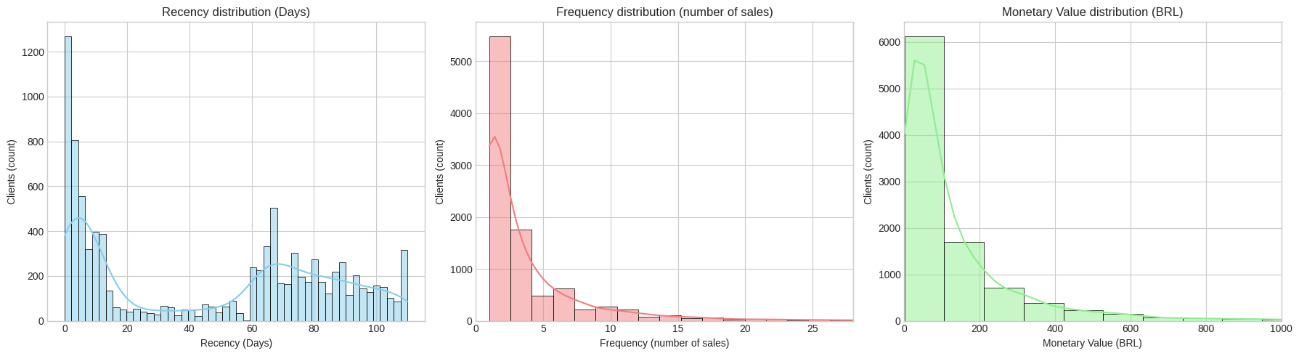
The RFM model is grounded in marketing theory and behavioral economics, where the recency of a customer’s last purchase is often predictive of engagement, the frequency denotes loyalty or habitual behavior, and the monetary value reflects purchasing power or profitability (Reinartz & Kumar, 2003). These three dimensions, when considered together, allow students to frame complex customer behavior within a three-dimensional space, ideal for both exploratory data analysis and segmentation. In our pedagogical pipeline, each customer was scored along these three axes. Recency was computed as the number of days since the customer’s last transaction relative to the latest transaction in the dataset. Frequency captured the count of distinct transactions, and monetary value represented the total amount spent by each customer. These values were then subjected to a logarithmic transformation to mitigate the impact of the inherent skewness in the distributions of RFM variables, ensuring that extreme values did not dominate the clustering process. Visualizations of the raw (untransformed) Recency, Frequency, and Monetary variable distributions, illustrating their inherent skewness, can be found in the Appendix. Subsequently, the transformed data were scaled using standardization (Z-score) to allow for clustering and visualization in comparable scale units. This transformation ensured that one dimension would not dominate due to differences in units or scale.
3.2. CLUSTERING VALIDATION: ELBOW METHOD AND SILHOUETTE SCORE
A crucial step in unsupervised learning is the selection of the optimal number of clusters. In the context of customer segmentation using the RFM framework, choosing an appropriate number of segments not only affects technical performance but also determines the interpretability and managerial value of the output. To address this challenge, we employed two widely recognized methods: the Elbow Method and the Silhouette Score, both of which can be replicated and interpreted pedagogically in a classroom setting (Han et al., 2011; James et al., 2021). These methods were specifically chosen for their balance of statistical rigor and pedagogical accessibility, allowing students to grasp complex concepts through intuitive visualization and quantitative metrics.
Elbow Method: Identifying the Point of Diminishing Returns
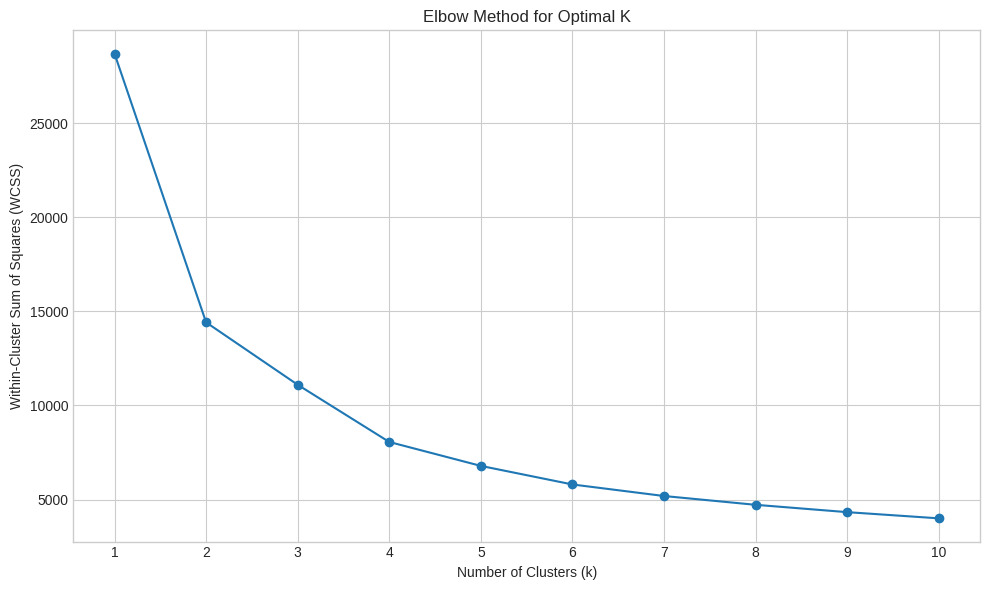
The Elbow Method evaluates the Within-Cluster Sum of Squares (WCSS), a measure of compactness that decreases as the number of clusters increases. The basic idea is to identify the number of clusters k where adding another cluster does not significantly improve the model, analogous to the “elbow” in a bent arm. In our experiment, we plotted WCSS for k values from 1 to 10. As illustrated in Figure 1, the curve displays a rapid decrease in WCSS between k=1 and k=4, after which the reduction plateaus, forming a clear elbow near k=4.

The point of inflection occurs around k=4, suggesting an optimal trade-off between compactness and model complexity. This step not only aids in model tuning but serves as an instructional moment to introduce learners to model selection heuristics. Educators may challenge students to justify the use of WCSS, explain the risk of overfitting with high k, and interpret inflection points visually (Witten et al., 2016).
Silhouette Score: Quantifying Cluster Separation
To further validate our choice, we computed the Silhouette Score, a metric introduced by Rousseeuw (1987) that quantifies how well each data point fits within its assigned cluster relative to other clusters. Values range from -1 to 1, where:
-
A score near 1 indicates well-separated clusters,
-
A score around 0 indicates overlapping clusters, and
-
A negative score suggests misclassification.
Following preprocessing, the RFM variables were subjected to k-means clustering. Two values of k, 3 and 4, were evaluated using the Silhouette Score, a metric that captures how well each object lies within its cluster compared to others. The highest score, as shown in Table 1, was obtained with k=4 (Silhouette = 0.3872), indicating better cohesion and separation of clusters.
While a Silhouette Score of 0.3872 does not indicate an extremely strong or perfectly separated cluster structure, it was the highest among the tested values for k≥3. In real-world datasets, particularly with complex customer behavior, achieving very high Silhouette Scores (e.g., above 0.5) is uncommon due to inherent data overlap and noise. This score, coupled with the clear ‘elbow’ observed at k=4 in the Elbow Method, suggests that four clusters offer the most interpretable and balanced segmentation for this dataset. This approach emphasizes that the “optimal” number of clusters is not solely a statistical output but a decision that integrates quantitative evidence, visual inspection (e.g., through techniques like PCA, presented in Section 3.4), and domain knowledge, a crucial lesson in data science education (Kodinariya & Makwana, 2013).
This method adds a quantitative lens to the visually-driven Elbow Method and fosters analytical thinking among students.
3.3 INTERPRETATION OF THE CLUSTERS OBTAINED VIA RFM
After determining that the four-cluster configuration yielded the highest Silhouette Score, we proceeded with a deeper interpretation of the RFM-based customer segments. The use of the Silhouette metric (Rousseeuw, 1987) was particularly relevant in this context, as it allows both the assessment of how well each observation lies within its cluster and the comparison between different k configurations. This makes it an intuitive yet statistically sound metric for teaching clustering concepts in applied data science courses (Tan et al., 2019). Following the clustering step, we conducted a descriptive statistical analysis of each group. It is important to note that while the clustering algorithm was applied to the logarithmically transformed and standardized RFM values (as detailed in Section 3.1), the interpretation of the resulting clusters is based on the original scales of the Recency, Frequency, and Monetary variables. Table 2 summarizes the characteristics of each cluster based on these original RFM variables: Recency, Frequency, and Monetary Value.
To interpret the outcomes of the RFM segmentation, we examine the statistical profiles of each cluster as summarized in Table 2. Each group represents a distinct behavioral segment based on purchasing recency, frequency, and monetary value. These insights form the basis for both pedagogical reflection and potential business interventions.
Cluster 0 – Dormant or Low-Value Inactive Customers (n = 3,442) This is a significant cluster, characterized by high average recency (79.62 days) and high median recency (82 days), indicating long periods of inactivity since their last purchase. Both frequency (mean = 1.17, median = 1) and monetary value (mean = BRL 29.61, median = BRL 24.77) are very low. This group likely represents customers who made a single, small purchase a long time ago and have since become inactive. From an educational standpoint, this segment can trigger classroom discussions on customer churn, the cost-effectiveness of reactivation campaigns, and the pedagogical contrast between customer volume and customer value.
Cluster 1 – Recent, Low Frequency, Mid-Value Customers (n = 1,801) This segment is defined by very low recency (mean = 6.54 days, median = 6 days), suggesting recent engagement. However, their frequency (mean = 2.13, median = 2) is low, and their monetary value (mean = BRL 63.18, median = BRL 52.01) is modest. This group may represent newly acquired customers or those who have recently been reactivated and are still in the early stages of their customer journey. Pedagogically, this cluster is valuable for discussing onboarding strategies, initial nurturing efforts, and how to encourage increased purchase frequency or higher average transaction values to transition them into more valuable segments.
Cluster 2 – Highly Engaged and High-Value Loyal Customers (n = 2,013) This cluster represents the “Brand Champions” or “Power Users.” They exhibit very low recency (mean = 7.20 days, median = 5 days), indicating very recent activity. Their frequency (mean = 10.77, median = 8) is high, and their monetary value (mean = BRL 377.36, median = BRL 281.18) is the highest among all clusters. This group is critical for understanding customer lifetime value (CLV) and prioritizing service quality. From an educational perspective, this segment provides opportunities for discussing Pareto principles, premium loyalty programs, and strategies for differential service to maximize retention and advocacy.
Cluster 3 – Lapsed, but Potentially Valuable Customers (n = 2,317) This cluster is characterized by high recency (mean = 65.56 days, median = 68 days), suggesting a period of inactivity, but with moderate frequency (mean = 3.53, median = 3) and mid-range monetary value (mean = BRL 148.99, median = BRL 113.83). Unlike Cluster 0, these customers were more active and spent more in the past, indicating a higher potential for reactivation. This segment is excellent for classroom discussions on customer re-engagement strategies, analyzing the cost-benefit of targeted campaigns to bring them back, and exploring what might have caused their lapse in activity.
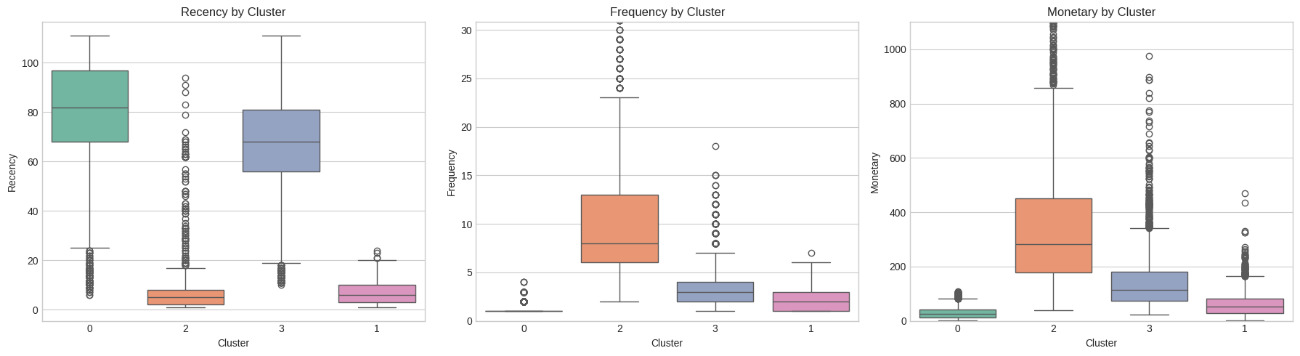
To support the analysis, we created visualizations that can be used directly in the classroom. Figure 2 shows a boxplot of each RFM dimension per cluster, revealing contrasting behaviors between the segments and visually reinforcing the distinct behavioral archetypes.
.png)
Cluster 2 (orange boxplots), representing the Highly Engaged and High-Value Loyal Customers, clearly stands out. In the Recency plot, its box is positioned very low, indicating the most recent purchases. In the Frequency and Monetary plots, its boxes are significantly higher than the others, showcasing high purchasing activity and spending. This visual pattern strongly confirms their status as the most valuable and active segment.
In contrast, Cluster 0 (green boxplots), indicative of Dormant or Low-Value Inactive Customers, consistently occupies the opposite end of the spectrum. Its box in the Recency plot is positioned very high, signifying long periods since the last purchase. Conversely, in both Frequency and Monetary plots, its boxes are at the absolute bottom, demonstrating extremely low purchasing activity and minimal spending. This visual representation vividly illustrates the challenge this large, disengaged segment poses.
Cluster 1 (purple boxplots), the Recent, Low Frequency, Mid-Value Customers, shows a low position in the Recency plot, similar to Cluster 2, confirming their recent activity. However, its boxes for Frequency and Monetary are notably lower than Cluster 2, but slightly above Cluster 0, reflecting their modest purchasing activity and mid-range spending. This visual pattern helps students differentiate between new/recently active customers and truly loyal, high-value ones.
Finally, Cluster 3 (blue boxplots), representing the Lapsed, but Potentially Valuable Customers, presents an intermediate profile. Its Recency box is positioned higher than Clusters 1 and 2, but lower than Cluster 0, indicating a lapse in activity. For Frequency and Monetary, its boxes are higher than Clusters 0 and 1, but lower than Cluster 2, suggesting a past history of more significant engagement. This visual distinction is crucial for students to understand why this segment, despite being currently inactive, holds higher reactivation potential than Cluster 0.
By connecting real business data with intuitive behavioral archetypes, this cluster interpretation becomes not only analytically informative but also didactically powerful.
3.4. PCA FOR CLUSTER VISUALIZATION AND PEDAGOGICAL ENGAGEMENT
Following the clustering procedure and the evaluation of the optimal number of clusters through the Silhouette Score, we employed Principal Component Analysis (PCA) to reduce the three RFM dimensions (Recency, Frequency, and Monetary) into two principal components. This approach enables a clearer visual representation of the clusters and supports interpretation in classroom contexts (Wickham & Grolemund, 2017).
The rationale behind this choice is rooted in the pedagogical need to simplify multivariate structures for students new to unsupervised learning. PCA transforms the original, possibly correlated RFM features into orthogonal axes, preserving maximum variance in the first few components. Even when starting with three dimensions, projecting onto two principal components often provides superior visual clarity for static representations compared to 3D plots, as it effectively separates clusters along axes of greatest variance and minimizes visual clutter. This aligns with educational practices in data science where visualization serves both exploratory and explanatory roles (Anderson et al., 2020).
To support this objective, we standardized the RFM variables using z-scores, applied PCA with two components, and projected each customer’s RFM score into the resulting two-dimensional space. We then colored the points based on the cluster labels obtained via K-Means, allowing for an immediate and interpretable understanding of the segment boundaries.
.png)
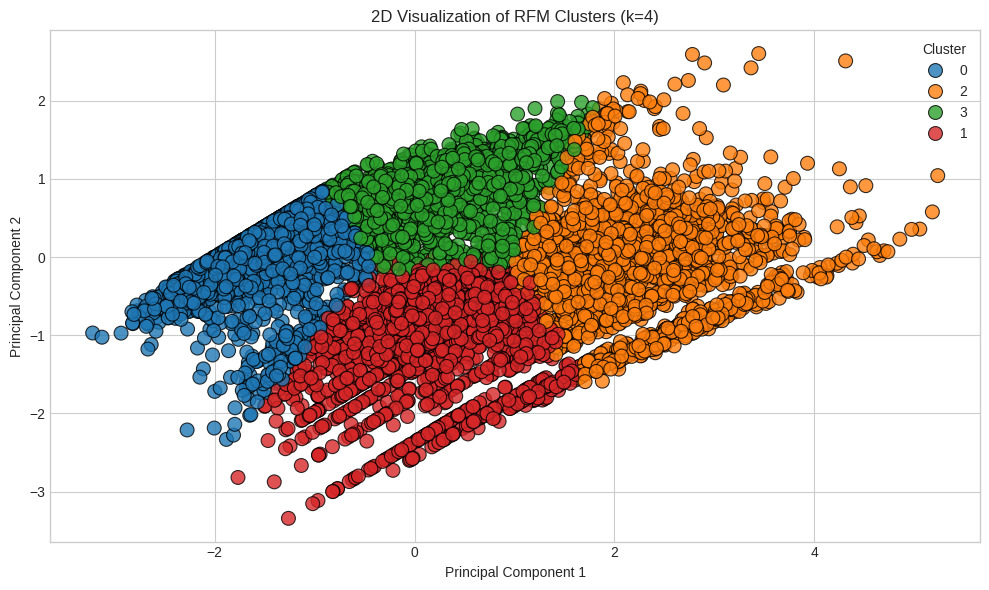
As illustrated in Figure 3, the clusters exhibit distinguishable groupings in the 2D PCA space, visually reinforcing their unique behavioral profiles. Cluster 0 (blue points), corresponding to the Dormant or Low-Value Inactive Customers, is primarily located in the lower-left region, reflecting their low engagement across RFM metrics.
Cluster 2 (green points), representing the Highly Engaged and High-Value Loyal Customers, forms a distinct group, generally positioned towards the upper-right region of the plot. This separation is consistent with their high Frequency and Monetary values, which contribute significantly to the variance captured by the principal components.
Cluster 1 (orange points), the Recent, Low Frequency, Mid-Value Customers, and Cluster 3 (red points), the Lapsed, but Potentially Valuable Customers, show more overlap with each other and with parts of Cluster 0, particularly in the central and lower-right areas. This closer proximity and overlap among these clusters invite class discussion on the limitations of linear separation in high-density areas and can motivate students to explore other non-linear dimensionality reduction techniques, such as t-SNE or UMAP, in advanced projects. The visual patterns, despite some overlap, effectively communicate the relative positions and distinct characteristics of each customer segment.
It is worth noting that although PCA does not consider the clustering structure during its transformation, the resulting projection supports intuitive comparison and has proven valuable in teaching unsupervised learning (Han et al., 2011; James et al., 2021; Wickham & Grolemund, 2017). Furthermore, differences in the dispersion and cohesion of the cluster points visually reinforce the insights previously obtained from the Silhouette analysis.

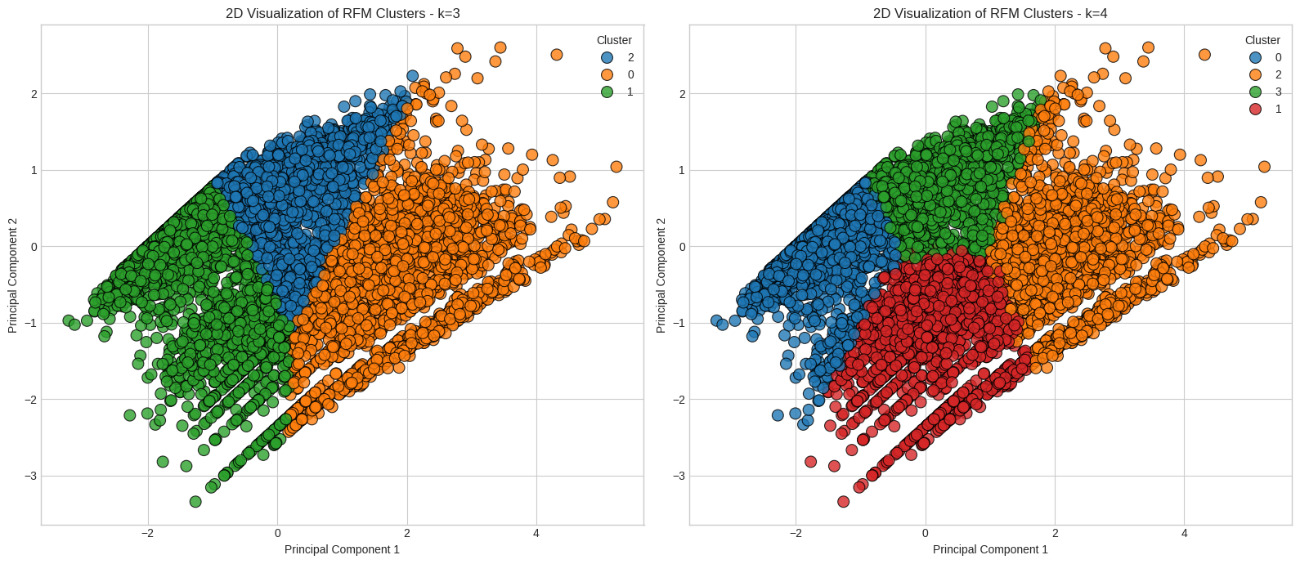
From a didactic perspective, this stage of the analysis offers a prime opportunity to introduce students to the concept of “cluster separability” and the visual validation of algorithmic choices. The stark difference in how clusters emerge in the k=3 versus k=4 scenarios, alongside their respective silhouette scores (0.3383 and 0.3872), provides tangible material for classroom dialogue and reflection. By visualizing the same data through different cluster lenses, students also learn that the “best” model is not solely a statistical choice, but one that balances interpretability, stability, and utility for decision-making, principles echoed in statistical education research (Garfield & Ben-Zvi, 2008).
4. DISCUSSION AND PEDAGOGICAL IMPLICATIONS
This study demonstrated the pedagogical efficacy of applying RFM-based customer segmentation using real-world retail data. The findings not only provide actionable business insights but, more importantly, create a versatile framework for teaching fundamental concepts in data science and statistical reasoning. This section discusses the broader implications of our approach, its pedagogical utility, potential adaptations for diverse educational contexts, and acknowledges inherent limitations while proposing avenues for future research and expanded pedagogical activities.
4.1. PEDAGOGICAL IMPLICATIONS OF RFM SEGMENTATION
The process and results of the RFM segmentation offer a rich pedagogical laboratory for students in data science and statistics, directly translating analytical findings into impactful learning experiences. Beyond its methodological structure, the RFM segmentation allows for rich interpretation of customer behaviors and supports a variety of real-world applications. In educational contexts, this stage offers an excellent gateway for interdisciplinary learning, bridging data analysis skills with strategic marketing, preparing students for roles in customer relationship management (CRM) and marketing intelligence.
Our RFM framework serves as another practical example of a problem-based learning approach designed to cultivate students’ quantitative skills, similar to the drill-based exercises described by Muniz, Geng, and Ganesh (2021) in this journal.
Students typically react with enthusiasm to real-world datasets, as they can immediately relate the abstract concepts of clustering to tangible customer behaviors, a finding consistent with research on student engagement and motivation in statistics courses (Neumann et al., 2013). The intuitive nature of RFM metrics makes the initial understanding of the data straightforward. As they delve into the analysis, the challenges of data cleaning (like handling CustomerID = 0), the decision-making in model validation (Elbow Method vs. Silhouette Score), and the interpretation of statistical outputs (means and dispersion) become practical exercises rather than purely theoretical problems. The visual representation of clusters via PCA often sparks curiosity, leading to questions about underlying patterns and the limitations of linear dimensionality reduction. This active engagement fosters deeper statistical reasoning and critical thinking.
Furthermore, the analytical pipeline serves as a conceptual bridge to render concrete often abstract statistical concepts. The need for the logarithmic transformation, for instance, ceases to be an arbitrary technical step and becomes a practical lesson on the impact of skewed distributions and outliers. Similarly, obtaining a moderate Silhouette Score (0.3872) offers a valuable pedagogical moment to debate the difference between ‘statistical optimality’ and ‘practical utility,’ teaching that interpretability is as crucial as the metric itself. Finally, visualizing clusters via PCA materializes the concept of ‘dimensionality reduction,’ allowing students to see how axes of greatest variance can be used to represent a complex structure in a simpler way.
To facilitate this engagement, instructors can leverage the RFM segmentation results through various classroom activities and projects. The framework provides fertile ground for inquiry-based learning, allowing students to explore practical meaning beyond numerical outputs. For instance, the variation in means and medians across clusters offers a chance to discuss skewed distributions, dispersion, and business outliers. The “Highly Engaged and High-Value Loyal Customers” (Cluster 2), for example, exhibit extremely high monetary values, which prompts discussions not only about segmentation but also about the importance of understanding and dealing with extreme values in real data. This is achieved through specific data transformations, such as the logarithmic transformation applied in this study to mitigate skewness and outlier influence, or through a qualitative analysis of their business significance, rather than arbitrary exclusion.
Furthermore, the moderate Silhouette Score obtained (e.g., 0.3872 for k=4) provides a valuable pedagogical moment to discuss the nuances of cluster validation in real-world scenarios, where statistical metrics must be balanced with business interpretability and the inherent complexity of customer behavior. Students learn that the ‘optimal’ number of clusters is not solely a statistical output but a decision that integrates quantitative evidence, visual inspection, and domain knowledge, reflecting the messy reality of data science practice. This dual-mode reasoning, blending intuitive and quantitative thinking, promotes statistical literacy and prepares students for real-world analytical work (Garfield & Ben-Zvi, 2008).
Concrete examples of activities and projects that can be implemented include (A comprehensive framework with detailed discussion points and activity ideas for each RFM customer cluster and sample pedagogical materials, including a project brief and a simplified assessment rubric, are available as supplementary materials):
-
Segment Characterization Project: Students are encouraged to go beyond numerical outputs and explore practical meaning. Assign each student group one cluster, tasking them to create a detailed “customer persona” including a descriptive name, key RFM characteristics, and hypothesized needs/preferences. This prompts questions such as: What defines a loyal customer versus an at-risk one? How do we explain outliers in monetary value? What interventions are cost-effective per segment?
-
Marketing Campaign Simulation: Challenge students to design a targeted marketing campaign (e.g., email, discount, special offer) for a specific cluster, justifying their strategy based on the segment’s RFM profile and estimating potential ROI. Such exercises encourage decision-making under uncertainty, integration of domain knowledge, and the ability to communicate data-driven insights, which are key competencies for the modern data-driven marketer (Wedel & Kannan, 2016).
-
Model Sensitivity Analysis: Students can experiment with different numbers of clusters (k) or alternative clustering algorithms (e.g., DBSCAN, hierarchical clustering) and compare the resulting cluster profiles and validation metrics, discussing the trade-offs involved. Educators may ask learners to compute silhouette scores across different datasets or compare clustering results obtained through alternative algorithms such as DBSCAN or hierarchical clustering (Tan et al., 2019).
-
Dashboard Prototyping: As an advanced extension activity, instructors can ask students to build a simple dashboard prototype (using tools like Python’s Dash/Streamlit or even Excel) that visualizes the RFM segmentation outcomes and supports marketing action recommendations, simulating a business intelligence tool.
-
Data Cleaning Challenge: Provide students with a raw version of the dataset (perhaps with more noise or missing values) and challenge them to replicate the pre-processing steps, including the decision-making process for handling issues like CustomerID = 0.
These activities collectively encourage students to move beyond algorithmic execution to critical interpretation, strategic thinking, and effective communication of data-driven insights, aligning with the core competencies emphasized in modern data science education. The entire segmentation process can be transformed into a modular classroom activity, where each student group explores a different cluster and reports back with insights, visualizations, and business recommendations. This approach, which breaks a complex project into manageable components, reflects the pedagogical benefits of a portfolio-based structure, which can increase individual accountability and ensure students engage with all stages of the research process (Kennett-Hensel et al., 2010).
4.2. ADAPTATIONS FOR OTHER COURSES AND LEVELS
The modular nature of the RFM segmentation process makes it highly adaptable to various educational settings and student proficiency levels:
-
Introductory Statistics/Data Literacy: For foundational courses, the focus can be placed on the intuitive interpretation of Recency, Frequency, and Monetary values, and the visual analysis of clusters (e.g., interpreting boxplots and PCA plots). Students can manually calculate RFM for a small sample dataset to grasp the underlying mechanics before using programming tools. The concept of “customer archetypes” can be emphasized, linking data to real-world business scenarios.
-
Intermediate Data Analysis/Programming: Students at this level can engage more deeply with the programming aspects (e.g., Python/R for data manipulation, RFM calculation, and clustering algorithms). The discussion can extend to the nuances of data pre-processing, including the rationale behind logarithmic transformations for skewed data and the selection of optimal k using validation metrics.
-
Advanced Data Science/Machine Learning: For advanced students, the RFM framework can serve as a baseline for more complex explorations. This includes comparing K-Means with other clustering algorithms (e.g., DBSCAN, hierarchical clustering, Gaussian Mixture Models), implementing different dimensionality reduction techniques (e.g., t-SNE, UMAP) for visualization, or even integrating RFM segments into predictive models (e.g., predicting churn or customer lifetime value). The discussion can also delve into model interpretability and the ethical considerations of customer segmentation.
-
Business Analytics/Marketing Programs: In these contexts, the emphasis shifts towards the strategic application of the segmentation. Students can focus on developing detailed marketing strategies for each cluster, performing cost-benefit analyses of different interventions, and designing key performance indicators (KPIs) to track the effectiveness of campaigns. Role-playing scenarios as marketing analysts or CRM specialists can enhance practical skills.
4.3. LIMITATIONS AND FUTURE DIRECTIONS
While this study highlights the significant pedagogical value of RFM segmentation, it is important to acknowledge certain limitations inherent to our specific application and scope, which also present fertile ground for future research and expanded classroom activities.
A primary limitation of our customer-centric RFM analysis was the necessary exclusion of transactional records associated with CustomerID = 0 (non-fidelized or unidentified customers). This decision, while crucial for focusing on individual, trackable customer behaviors, meant that a substantial portion of the overall transactional volume was not directly segmented by RFM in this study. This limitation can, however, be transformed into an advanced classroom exercise. Students could explore alternative analytical approaches for these non-identified transactions. For instance, a Market Basket Analysis (MBA) or Association Rule Mining could be applied to the entire dataset (including CustomerID = 0), focusing on SaleID (shopping cart) and ItemDescription). While RFM answers “who are our best customers?”, MBA addresses “what products are bought together?”. This complementary analysis would reveal product co-occurrence patterns across all transactions, regardless of customer identification, offering insights into cross-selling and product placement strategies that are not dependent on individual customer tracking. This would demonstrate to students how different analytical techniques address distinct business questions and data limitations.
Another limitation is that our current RFM model provides a static snapshot of customer behavior over a defined historical period. Real-world customer behavior is inherently dynamic, and customer segments can evolve over time. Future studies or advanced classroom projects could therefore explore dynamic RFM segmentation (e.g., using rolling windows or time-series analysis) to track customer migration between segments over time. This would introduce students to concepts of customer lifecycle management and churn prediction, and the challenges of modeling temporal data.
Furthermore, the current segmentation relies exclusively on transactional RFM metrics. While powerful, this approach does not incorporate other potentially rich sources of customer information. Students could be challenged to integrate additional data sources (e.g., demographic information, survey data, website interaction data, product category preferences from ItemDescription) to enrich the segmentation. This would introduce concepts of multi-source data integration, feature engineering from diverse data types, and the benefits of a more holistic customer view.
Lastly, this study primarily utilized the K-Means algorithm for clustering. While effective and pedagogically accessible, K-Means has assumptions (e.g., spherical clusters of similar size) that might not perfectly fit all real-world data distributions. Comparative studies using other clustering algorithms (e.g., hierarchical clustering, DBSCAN, Gaussian Mixture Models) and their respective validation metrics could therefore be explored. This activity would allow students to critically discuss the strengths and weaknesses of different clustering approaches in various data contexts and understand the impact of algorithmic assumptions on segmentation outcomes.
Finally, an inherent limitation of this study is its nature as a proposed pedagogical framework rather than a report on an empirically validated intervention. Although the case study and suggested activities are grounded in solid pedagogical principles, their direct effectiveness in promoting student learning has not been formally measured. This gap, however, opens a clear path for future research. Subsequent studies could apply this methodology in classroom settings to quantitatively and qualitatively assess its impact on developing students’ statistical reasoning and their ability to handle the complexity of real-world data.
5. CONCLUSION
This article presented a comprehensive framework for applying RFM-based customer segmentation using real-world retail data, specifically highlighting its profound pedagogical value for marketing analytics and CRM education. We demonstrated how a seemingly straightforward business analytics technique can be transformed into a rich, hands-on learning experience that transcends mere technical skill acquisition.
Our primary contributions include a practical, replicable methodology for RFM segmentation, encompassing data pre-processing (including handling real-world data nuances like non-identified customers and data transformations) to cluster validation and interpretation. We also provided a clear identification of four distinct customer segments, each with unique behavioral profiles, offering tangible examples for business strategy discussions. Furthermore, a detailed articulation of educational insights was provided, offering concrete examples of how each stage of the analysis can be used to foster critical thinking, statistical reasoning, and problem-solving skills in students, emphasizing the importance of interpreting results in a business context and making data-driven decisions. Lastly, suggestions for classroom activities and projects were outlined, ranging from basic segment characterization to advanced model sensitivity analysis and dashboard prototyping, all designed to promote active and experiential learning.
The relevance of this work for marketing education is multifaceted. It provides educators with a robust, real-world case study that connects theory to practice, bridging abstract statistical concepts (like clustering, dimensionality reduction, and data distribution) with their practical application in a familiar business context. It also cultivates data literacy, equipping students with the ability to not just perform analyses, but to critically interpret results, understand their limitations, and communicate insights effectively to diverse audiences. Moreover, it promotes interdisciplinary learning, integrating statistical methods with marketing, business strategy, and computational thinking, and fosters critical engagement with data challenges, encouraging students to confront and strategize around real-world data complexities, such as skewed distributions and non-identified data points, rather than relying on idealized datasets.
By offering a structured approach to RFM segmentation as a pedagogical tool, this study contributes to the ongoing effort to enhance the quality and applicability of data science education, preparing students to become data-literate decision-makers capable of navigating the complexities of real-world data environments.
DISCLOSURE STATEMENT
The authors declare no conflicts of interest.
DATA AVAILABILITY STATEMENT
Deidentified data have been made available as supplementary material.
SUPPLEMENTARY MATERIAL
Data set: The transactional dataset used (bakery.csv).
Python code: The Python code (Python_Code_Guide_RFM_Analysis_and_Customer_Segmentation.ipynb) and the file (Python Code Guide.pdf).
_recency__(b)_frequency__(c)_monetary_value.png)