
INTRODUCTION
Today’s higher education students are part of a generational cohort now commonly referred to as Generation Z (Gen Z), and it is not known the extent to which Gen Z’s will demonstrate similar preferences and decision-making behavior as those of previous generations (Mahesh et al., 2021; Wajda et al., 2022). Gen Zs range in age from 8 to 24 years of age, and number approximately 65 million in the United States. They share some characteristics with their millennial predecessors, such as an aspiration to purchase from, and work for socially conscious companies (Lu et al., 2013; McGlone et al., 2011), but are also characterized as more cynical and distrusting of institutions (Debevec et al., 2013; Gutfreund, 2016). Another characteristic of this cohort is their pragmatism and motivation to maximize the utility of their spending; relative to previous cohorts, however, this generation is also burdened with record levels of student debt load at graduation, now exceeding an average of $37,000 (Beal et al., 2019). Finally, they are the first generation to regard the physical and digital world as borderless, where every physical aspect, people, and places, has a digital component (Edmond & Driskill, 2019; Riley & Nicewicz, 2022; Stillman & Stillman, 2017). Given that Gen Z are perceived as pragmatic in nature, motivated to maximize the utility of their spending, burdened with student debt, and are the first generation to regard the physical and digital world as borderless, how do Gen Z students prefer to learn? Gen Z now makes up most traditional higher education students, yet little research (e.g., Seemiller & Grace, 2016, p. 2017) has examined their preferences within a higher education setting, or more specifically what classroom instructional methods they prefer.
Faculty today have available to them an almost overwhelming number of options when it comes to instructional methods and how to design their courses (Iqbal, 2023). Advances in technology and events such as the Covid-19 pandemic has made distance learning not only viable and necessary, but for some learners even superior to traditional face-to-face delivery. Innovations in pedagogy have produced a variety of alternatives to traditional lecture-based teaching formats such as flipped classrooms, problem-based learning, the case method, and team based-learning. Indeed, the calls within marketing academia (e.g., Crittenden et al., 2019; Rohm et al., 2019) for faculty to innovate and embrace the digital world in order to properly prepare marketing students for the demands of the marketplace are compelling (Iqbal, 2023). Instructors also have numerous decisions to make on how to structure their courses. These decisions include such considerations as: amount of course workload, grading rigor, whether or not to use a textbook, attendance policies, use of guest speakers, individual vs. group assignments, essay vs. multiple choice questions, take home vs. in-class exams, the relative weights assigned to exams vs. projects and assignments, requiring students to make oral presentations, and the percentage of class-time devoted to lecture, class discussion and/or in-class assignments/activities.
As a result, there has been a high volume of research within the instructional design area of the teacher education discipline that have analyzed these various pedagogical issues and the results have been very helpful to faculty looking for guidance on how to best design and deliver their courses (e.g., Mackh, 2018; Nilson, 2016). Rightfully the bulk of the literature in this area has been on developing best practices on how to use different instructional methods and delivery systems and the advantages and disadvantages of the different methods. One area that has received less attention, however, is student preference for different instructional methods (Swanson et al., 2021). Similarly, there has been little investigation of the potential impact of this generational cohort’s characteristics on their preferences for instructional design. As asserted by Dubas and Strong (1993), the selection of instructional methods by an instructor should be driven by perceived learning effectiveness, instructor preference and positive prior experience, but growing support for student-centered learning (Swanson et al., 2021; Wright, 2011) suggests the preferences of students should also have some influence in the decision-making process.
There are three key reasons why student preference should be considered when designing classes or programs, and they include the following: 1) Students are partners in the learning process (Mark, 2013) and thus their perspectives should be considered. While different students will have different instructional preferences at the individual level, at the group level it is likely that significant preferences for specific methods can be discerned. 2) Student preferences and satisfaction could affect enrollments in the class or program (Swanson et al., 2021). As the competition for Gen Z students between schools and programs increases, especially in the aftermath of the COVID 19 pandemic, it would be unwise for any entity in this education marketplace to ignore the preferences of the ultimate decision-makers. 3) With many advocating that higher education should move from an instructor centered learning model to more of a student centered learning model (Dubas & Strong, 1993; Wright, 2011), it would seem to make sense for the professor to adapt their teaching methods to the preferences of their students, rather than asking an entire class of students to adapt to the preferences of their instructor.
The purpose of this research study is to examine undergraduate marketing student preferences for various instructional methods. More specifically, what instructional methods are most and least important to marketing undergraduate students when selecting a class? Within each instructional method, what is the preference for the different options (i.e., levels)? It was beyond the scope of the study (or the conjoint methodology employed) to determine importance and preference for every instructional method. As a result, this research study examined the importance of six different instructional methods and the preference for each option within each instructional method, which include the following; delivery method (face-to-face vs. hybrid), flipped classroom (yes vs. no), use of student response system (SRS vs. no SRS), workload (average vs. above average), how class time is spent (lecture vs. interactive), and competition (weekly competitions vs. no competitions). These results should provide valuable insight to instructors who would like to consider Gen Z marketing student preferences when designing the pedagogy of their marketing courses.
Segmentation is a key marking concept because it leads to a better understanding of customers in the marketplace and helps guide a firm’s marketing strategy and resource allocation (Cortez et al., 2021). Research suggests that customer segments should be identified and developed via customer needs, preferences, or the importance of attributes (Garver & Williams, 2025). Ritter and Pedersen (2024) suggest customer segmentation is only valid if the segments are based on customer needs, preferences, or importance of attributes. Understanding customer (i.e., student) segments can be valuable to departments and colleges when creating and offering a portfolio of different class formats to meet the needs of different segments.
In a similar manner, academic researchers suggest that theory driven research should test for the existence of unobservable customer segments (i.e., customer heterogeneity) in the sample (Hair et al., 2022). Researchers suggest that not recognizing the existence of customer segments can threaten the validity of the analysis because it conceals differences among participants in the sample (Hair et al., 2022). Additionally, the research results become more insightful and nuanced when customer segments are identified and developed. Thus, identifying and developing customer segments from the preference for different instructional methods becomes a secondary purpose of this research study.
To fulfill the purpose of this study, we will first discuss discrete choice analysis and utility, which will serve as the theoretical framework for this research study. Then, a discussion of generational cohorts, specifically Gen Z, will be put forth, followed by an examination of relevant instructional methods employed in higher education. Statistical results from discrete choice analysis will be provided, followed by latent class cluster analysis to identify customer segments based on the preference for different instructional methods. Then, a discussion of those results will take place, which will address both student preferences and student learning associated with the different instructional methods. Finally, limitations, future research and final conclusions will be put forth.
THEORETICAL BACKGROUND
Discrete Choice Analysis and Utility
The underlying theoretical foundation for this study is discrete choice analysis (DCA). DCA originates in modern economic choice theory, which assumes the market behavior of individuals is generated by the maximization of preferences (i.e., utility). It seeks to predict and understand how people form preferences and make decisions when they must choose between discrete alternatives - such as deciding which job offer to take, which product to purchase, or which class to select. This approach has been extensively used to better understand customer choices (e.g., Verma et al., 2002), and has been found to be effective in predicting actual decision-making through experimentation. Nobel Laureate Daniel McFadden (1986, p. 275) refers to market researchers explicitly modelling “the cognitive mechanisms in the black box that govern behavior, and then use experimental data on consumer perceptions, preferences, and intentions to fit this model.” Further, McFadden (1986) described five critical (latent) constructs in modeling the cognitive decision process (i.e., perceptions, attitudes, preferences, decision protocols, and behavioral intentions). Specifically, he identified “perceptions or beliefs regarding the products, generalized attitudes or values, preferences among products, decision protocols that map preferences into choices, and behavioral intentions for choice.” Further, these constructs influence each other in the following way: perceptions and attitudes each individually influence preferences, then preferences and decision protocols each influence behavioral intentions. See McFadden (1986, p. 276) for greater detail on constructs and relationships.
Our research is ultimately aimed at uncovering preferences in hopes of better predicting the demand for a package of instructional methods (i.e., the manifestation of behavioral intentions). The subjects of this investigation are Gen Zs that, as evidenced by their actions, apparently share a perception that the overall product (i.e., a college education) and the courses they select as worthy of pursuit. As discussed previously, they also appear to possess common attitudes and values, i.e., institutional skepticism, trust-seeking, pragmatic consumerism, and informational transparency. Further, our subjects’ decision protocols are arguably affected by their common “phigital” view of the world and, for many, a heavy debt burden. We also previously asserted that students’ relative preferences for instructional methods is a function of maximizing utility. Often, the utility maximization assessment is based on a constrained level of spending available to the individual, e.g., can I afford to go college as well as forego a full-time income? In this study, however, we assume that the student is enrolled and committed to a certain number of classes at a given level of tuition, and there is no substantive difference in price between the alternative instructional methods. Without price as a utility constraint, the question becomes “what drives the students’ utility maximization assessment?” We offer that, given a student’s financial commitment to a semester of classes and their desired outcomes of those classes (e.g., cognitive and grade point results), their key constraint is time. Further, we assert that time-utility, a phigital view and debt burden potentially interact to inform their decision protocol. That is, a Gen Z with a high student loan debt may feel more time constrained because of the need to work more hours and is more motivated to use digital technology to help manage their time. In summary, we broadly assert that Gen Zs’ share similar perceptions, attitudes, preferences, and decision protocols that directly and indirectly influence their behavioral intentions, i.e., the courses they ultimately select.
Gen Z
Approximately 16.8 million students are enrolled in U.S. colleges and universities, the majority of which are members of “Gen Z.” Instead of using birth chronology to differentiate generations, generational cohort sociologists focus on events that produce a change in social values and norms; cohorts (i.e., individuals born during the same span of years) are influenced by the external events and context of their formative years. These shared experiences/contexts can effectively differentiate one cohort from another, and of interest to educators, they are believed to shape the cohort’s preferences, desires, attitudes, and (potentially) decision-making. Gen Zs are defined as anyone born after 1994-1996 (Dimock, 2019; Stillman & Stillman, 2017), and before 2012-2014. There is not necessarily agreement on the cohort’s exact beginning and ending birth years, but there is some consistency in the thesis that the Gen Z cohort may be distinguished in three broad categories: event exposure, digital orientation, and debt.
First, like previous cohorts, Gen Zs are highly influenced by the events of their times. This cohort’s exposure (and their parents’ response) to events such as the 9/11 terror attack, increased mass shootings and bombings, the great recession, and Covid-19 pandemic has a substantial influence on their view of the world and behavior. Because of the occurrences they have observed and lived through, Gen Zs are believed to be highly skeptical, even cynical, about the information they receive from societal institutions (e.g., government, profit and not for profit organizations). They seek to establish “trust” with their employers and entities with which they interact, and their loyalty must be earned by potential employers and institutions seeking their attention (Gutfreund, 2016). They are also pragmatic consumers, price conscious and possess an expectation that information about goods and services should be highly transparent (Gutfreund, 2016; Stillman & Stillman, 2017). These event-driven generational traits (institutional skepticism, trust-seeking, pragmatic consumerism, and informational transparency) may be a compelling consideration when assessing their preferences for instructional methods.
Second, from early childhood this age group has been exposed to the digitization and mobilization of products and services, as well as constant connectivity, immediate access to information, and on-demand entertainment (Riley & Nicewicz, 2022; Wajda et al., 2022). The use of social media as a source of information and a platform for personal expression is also integral to Gen Z thinking and behaviors (Dimock, 2019). The physical and digital world have merged for Gen Zs, resulting in a “phigital” lens (Edmond & Driskill, 2019; Stillman & Stillman, 2017) through which they judge all information to which they are exposed. As such, we suggest that this generation’s unique view of technology, the physical world, and information is also relevant to the discussion of instructional methods (Riley & Nicewicz, 2022; Wajda et al., 2022).
Finally, the 2001 recession and the financial crisis of 2008 resulted in reduced government funding of higher education, while the cost continued to rise. Student debt burdens acquired in the 2000s grew exponentially over previous years; students leaving college today are burdened with the highest levels of student debt in recorded history; the average student who graduated in 2016 has a debt burden of over $37,000 (Friedman, 2017). As one might expect, research such as Millet (2003) found that highly indebted students were less likely to move to advance their education, find better employment, and were more likely to live with their parents after graduation. In addition to the influence of events and technology on the perspective of Gen Z students, their debt burden may also influence their perspective of instructional methods.
Studies focusing on the effect of these broad characterizations (i.e., event-driven traits, digital/physical lens, and increasing debt) of Gen Zs in the context of higher education learning is limited (Riley & Nicewicz, 2022). Seemiller and Grace (2017) suggest that Gen Zs prefer hands-on learning opportunities that are broadly applicable, like to first observe others completing a task before attempting on their own, and are more accustomed to engaging in individual learning wherein they can “set their own pace, and make meaning of their learning before having to share that meaning with others” (Seemiller & Grace, 2017, p. 23).
Review of Instructional Methods
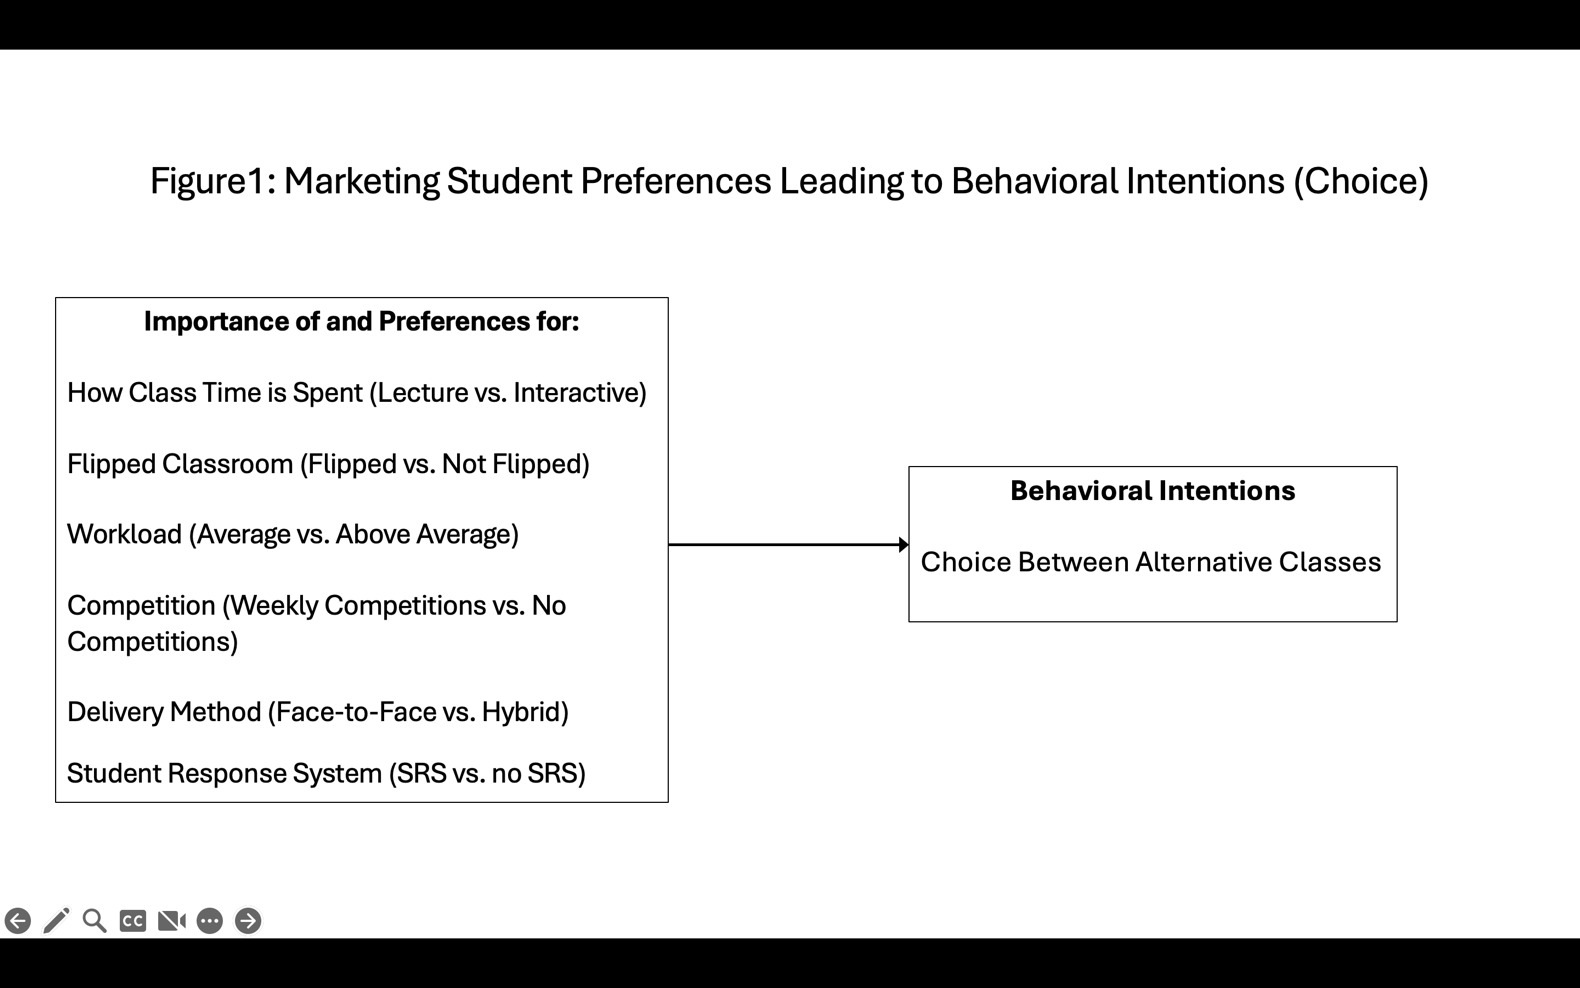
While there are a large number of instructional methods available, this section will focus only on those methods relevant to this study (See Figure 1), which includes the following: how class time is spent (lecture vs. interactive), flipped classroom (yes vs. no), delivery method (face-to-face vs. hybrid), use of student response system (SRS vs. no SRS), competition (weekly competitions vs. no competitions), and workload (average vs. above average).
How class time is spent (Lecture vs. Interactive)
Most courses are composed of two general components, broad coverage of the discipline specific knowledge in the course’s subject area coupled with some drill down to application and in-depth exploration of key issues. The lecture format generally excels at the first component and must be supplemented with out-of-class assignments (e.g., term papers, book reports, projects, cases) to provide the second. Interactive class sessions generally excel at depth and application, but they must be supplemented with outside video or reading content to provide the breadth and context. While research data suggests that interactive classes can be more effective than lecture based on a learning outcomes perspective (Garver & Roberts, 2013; Iqbal, 2023; Ostapski et al., 2009; Rohm et al., 2019), it is not clear which approach is preferred by students.
Some students may prefer interactive classes for the following reasons (Iqbal, 2023); 1) class sessions with active learning exercises may do better on the boring factor than lecture. 2) by forcing students to come to class prepared, content can be broken-up and absorbed in more manageable chunks by students. Some students may like that the interactive format forces them to keep up and get them out of the habit of last-minute cramming. 3) the application focus of active learning exercises may make class seem more relevant and less theoretical. Seemiller and Grace (2017) suggest that Gen Z students prefer hands-on learning experiences where they can immediately apply their knowledge to a variety of situations and contexts.
Some students may prefer the lecture format because of the following: 1) they may view in-class activities as busy work; not always getting the point of learning exercises, and how they relate to course concepts. 2) some students may believe they learn broad course content better from a well delivered live lecture than from a textbook. 3) some students may believe it is more time-efficient for them to use a just-in-time learning process in which they can postpone learning until right before an exam or a key assignment is due, and do not want to be forced to keep up. 4) Absence-prone students may see interactive classes as more punitive to missed classes.
Gen Z’s pragmatism and desire for informational transparency would seem most relevant to this preference. The lecture-based approach could arguably be perceived by this cohort as less practical because it reduces their overall utility; missing a lecture results in a loss of exposure to key information that they now have to acquire some other way. Whereas, the interactive format provides for the ability to miss class, and still allow for information acquisition. Similarly, the interactive format would be perceived as more transparent, wherein information is available to all students regardless of their relative attendance in class.
Flipped Classroom (Yes vs. No)
Flipped classroom reverses (i.e., flips) the traditional model of teaching in which class sessions are devoted to lectures and “homework” assignments are done by students outside of class. In the flipped classroom, students are given video lectures to watch before class, which allows class sessions to be devoted to active learning exercises that that force students to apply the concepts covered in the assigned videos (Zuber, 2016). It is not uncommon for flipped classrooms to start with an accountability quiz to ensure that students are prepared for class. While some instructors use the flipped classroom (video lectures to watch before class) and then lecture in class as a tool to deliver more content, best practice suggests that the flipped classroom is better used when it allows for more interaction in the classroom. The main premise of this pedagogy is that the one-way flow of information that typifies lecture is best communicated to students outside of class and that application of concepts is best done in class with an instructor and fellow students available to help (Garver & Roberts, 2013).
From a student preference standpoint, the flipped classroom may offer some positives to students that could make it more preferred. 1) Class sessions allow class time to be more focused on active learning activities which may be more engaging for students than passively receiving lectures (Zuber, 2016). 2) If students earn points through accountability quizzes and exercises, then grades are not so heavily influenced by a few major exams or projects. This can be a major benefit to students who do not believe that they are good test takers. 3) Rather than working on homework assignments at home alone, in-class exercises provide students with more opportunities for hands on assistance from faculty, team members, or classmates. 4) The flipped classroom pedagogy provides strong incentives to force students to keep up and not procrastinate – something many students may feel they lack the self-control to do this on their own, thereby helping them perform better. Seemiller and Grace (2017) suggest that Gen Z students prefer to seek new information and to watch various tasks being done via video on social media outlets such as Youtube. With this in mind, Seemiller and Grace (2017) suggest that flipped classrooms that employ video lectures are preferred by Gen Z students. Likewise, Neier and Zayer (2015) found that higher education students indicate that Youtube has the highest potential for learning of all social media platforms. Yeh and Zoeckler (2022) suggests that learning outcomes are improved significantly when online resources (i.e., online videos) are utilized.
On the other hand, some students may see negatives associated with a flipped classroom. 1) students may need to come to class prepared, or they may lose accountability quiz or exercise points. This may be daunting for students who tend to procrastinate or are overscheduled/time pressured. 2) if an accountability quiz or exercise points are given in class, then this structure is more punitive toward absences, so students who tend to miss class may not prefer this format. 3) accountability quizzes during each class session may irritate students who are not used to having to prepare for class or consider themselves poor quiz takers. 4) content delivery via face-to-face lectures is typically more engaging than the video alternative offered by this approach. 5) some students may not like being forced to be actively engaged in class and would prefer to be left alone. 6) students who are satisfied with how well they have performed in classes taught using the traditional lecture format, may feel a different approach is risky for their GPA. 7) some students may feel the constant need to prepare for class, quizzes, and assignments may result in an increased workload, thereby jeopardizing their ability to adequately prepare for other classes.
Like the interactive class format, we speculate that Gen Z students would find the flipped classroom as more transparent and therefore more appealing. Similarly, we would argue that the flexibility afforded by the flipped format provides Gen Zs with an increased opportunity to learn on their own time, which in turn allows for greater opportunity for paid employment. Thus, the debt burden faced by Gen Z students may influence their preference when considering a flipped class. Alternatively, if points are awarded to accountability quizzes, then the consequences of missing class may once again inversely influence this preference.
Delivery Method (Face-to-Face vs. Hybrid)
As distance learning is becoming more pervasive, some instructors are splitting class time between face-to-face and online instruction. Some consider the hybrid approach (i.e., blended learning) the best since it allows instructors to customize their class in a way that allows them to take advantage of the strengths of both the face-to-face and online delivery (Amrein-Beardsley et al., 2007; Bersin, 2004). Other researchers consider it a “stuck in the middle strategy” that contains the best and worst of both approaches (Jackson & Owens, 2008). In their study focused on comparing face-to-face versus a blended hybrid approach Northey et al. (2015) determined that students who participated in the blended hybrid format “were more engaged than students who only attended face-to-face classes” and “participation in the asynchronous setting relates significantly and positively to students’ academic outcomes (final grades)” (pp. 171).
From a student preference perspective, positives of the hybrid format are as follows: 1) It allows more flexibility in terms of time commitments, perhaps allowing more time for a student to work (which may be especially important for debt-burdened Gen Z’s), or participate in extra-curricular activities (Jackson & Owens, 2008). 2) the online aspect allows students more control over how they receive course content. Live lectures are fleeting, yet online content can be accessed as many times as needed to understand the concepts being presented (Davies et al., 2016). 3) efficiencies are gained to the extent that students will not have to deal with the logistics of attending as many classes in person, e.g. travel, parking, grooming, getting dressed (Goralski & Falk, 2017; Jackson & Owens, 2008). 4) some students may believe online delivery is easier with a lower workload (Goralski & Falk, 2017).
Potential negatives of hybrids from a student preference perspective 1) not all students have reliable access to adequate laptops and WIFI (Zuber, 2016) or a quiet place at home to work (Jackson & Owens, 2008). 2) our experience indicates some students have technostress particularly regarding taking exams online. 3) taking a hybrid class along with a group of traditional classes may leave holes in a student’s schedule, creating time inefficiencies. 4) some feel the online component will add to their workload in terms of more assignments being required - e.g. accountability quizzes and discussion boards in addition to traditional exams, projects and assignments (Jackson & Owens, 2008).
The Gen Z cohort is described as having a “phigital lens” in which they are highly capable of toggling between the digital and physical worlds, and as such may appreciate that blended learning keeps things more interesting for them by providing them with a variety of alternative learning experiences. Conversely, it is also important to consider that Gen Zs are also very familiar with technology. As a result, they may be expected to have high expectations for state-of-the-art technological content and processes in a hybrid format. Finally, the hybrid format reduces facetime with professors by design. This reduced facetime may be perceived as diminishing the ability for Gen Zs to build trust with their professors.
Student Response System (SRS vs. No SRS)
The main purpose of classroom response systems (SRS) is to increase student engagement and interaction in the classroom (Garver & Roberts, 2013). Florenthal (2019) suggests that SRS can be a convenient tool that can motivate students to seek knowledge and to express their thoughts, while allowing the professor to better facilitate interaction. In addition, it also allows instructors to administer class surveys, receive instant feedback, take attendance, pose questions to track understanding or expose areas of misperception, and class results can be quickly displayed through classroom mediation (Garver & Roberts, 2013). SRS also allows instructors to quickly and efficiently administer in-class accountability quizzes and assignments. The main purpose of SRS is to use mobile technology to increase student engagement and to allow students to more easily express their ideas as well as facilitate classroom discussion (Bruff, 2009; Flornethal, 2019) and to create efficiencies in receiving student feedback on engagement questions as well as efficiencies in grading accountability quizzes.
From a student preference standpoint, the positive aspects of using SRS are as follows; 1) students may feel more engaged and that class will be more interactive. 2) student receives instant feedback on their performance and understating of course concepts. 3) efficiencies in quiz taking…no scantron sheets to bubble in. 4) efficiency of SRS allow more assignments to be administered thereby spreading out points and reducing the impact of major exams and projects on a student’s grade. In a more recent study on the use of mobile polling in the classroom, Florenthal (2019) determined that students’ use of the technology was motivated by knowledge acquisition and learning, suggesting that students may prefer the use of SRS in the classroom.
Potential negatives of SRS from a student preference perspective are as follows; 1) the technology allows instructors to more easily hold students accountable for coming to class prepared, this may be disliked by habitual procrastinators and those who prefer to cram. 2) use of SRS may be perceived as being punitive to absences, and thus less preferred by those who believe attendance should be optional. 3) technophobes may be concerned about SRS malfunction affecting their grade. 4) forgetful students may be concerned about losing their SRS device (i.e., clicker) or forgetting to bring it to class. 5) the cost of purchasing a SRS device or license. 6) the efficiency of SRS allows more assignments to be administered thereby increasing the perceived workload in the eyes of some students. It is important to note that Florenthal (2019) found that some students were irritated by the use of SRS (i.e., technology issues, pace issues) and as a result did not prefer this technology. The use of SRS would seemingly appeal to Gen Zs as a digital tool. Similar to the use of a hybrid format, however, the incorporation of the technology needs to be seamless and effective in the eyes of a discerning audience.
Competition (Weekly Competitions vs. No Competitions)
Some classes are structured such that students or teams of students compete against each other in class on assignments, sometimes for in-class points or other rewards. The rationale for competition is that it provides enhanced motivation to not just provide an acceptable solution - but the best solution, and it helps prepare students for the competition inherent in the workplace (Kistruck et al., 2016). Pena et al. (2024) found that semester long competitions significantly increased learning outcomes as well as engagement and student satisfaction.
This is especially relevant to this study, where the students are majoring in marketing, one of the most competitive work environments in business. Others believe competitions produce negative side effects (such as cheating, playing to the judges, decreased self-esteem for the losers, reducing intrinsic motivation to learn) and believe cooperation is a more productive model (Brentnall et al., 2018).
From a student preference perspective, competition may be considered a positive for the following reasons: 1) competitions will make class more engaging and involving. 2) competitions may provide opportunities for students to gain recognition. 3) competitions can be viewed as turning class into a game, which is a fun way to learn (Garver & Roberts, 2013). 4) confident students may think they will do well in the competitions thereby working into their favor in terms of GPA. 5) competition will help prepare them for the competition they will face in the business world. Academic researchers suggest that gamification is popular with higher education students and becoming more important in marketing to influence customer relationships and purchase decisions (Crittenden et al., 2019). Thus, competition in the classroom is aligned with gamification trends in the marketplace.
In terms of negatives, some students may not prefer competition in class for the following reasons: 1) students who are not competitive by nature may not want their grade dependent on how well they compete. 2) less confident students may feel they will not fare as well in these competitions, and some may fear they will be publicly embarrassed by their poor performance (Cheng et al., 2009). 3) to the extent that a student perceives themselves as more of a deliberative thinker rather than as quick-on-their-feet, they may feel they will not fare well in-class competitions, thereby hurting their grade.
For these reasons, we speculate that competition in the classroom is arguably problematic for some students in the Gen Z cohort in terms of trust-building. Because the competitive approach necessitates “winners and non-winners,” exposes competitive strengths and weaknesses, Gen Zs may see it as diminishing their trust in their professor and fellow students. In this format, informational transparency may also work against Gen Z preference, because the students necessarily are aware of everyone else’s scores in a particular competition.
In contrast, we are focusing on marketing students who may inherently be more competitive in nature than their Gen Z counterparts. In short, one could argue that competitive Gen Z students are more likely to become marketing majors and thus will embrace competition in the classroom. In addition, gaming is a common leisure activity for Gen Z students, and they may embrace competition for exactly this reason.
Workload (Average vs. Above Average)
Our experience indicates to us that perceived workload is an important factor that students consider when choosing a class. Unlike the other instructional methods included in the study, workload is not considered a true choice variable, since few if any students prefer a heavy workload over a lesser one. It is included in the study not to see which level of workload is more preferred, but rather to assess how important a factor it is in driving student preference in comparison to the other study instructional methods. Students may perceive that different methods result in different workloads (i.e. one may believe a flipped classroom course requires more work) thereby influencing student preference/choice decisions. Since faculty can control course workload independently of the instructional method they decide to use, it is best to account for its importance separately, so that its impact can be more accurately estimated. For example, if workload is found to be less important to students than other instructional factors, faculty may see that using more student-preferred methods as a way they can increase course workload and rigor without driving down overall student preference for their course. On the other hand, if workload is the key driver of student choice, then faculty may choose to moderate their workload to address student preferences. Through the eyes of Gen Zs, we suggest that workload most closely ties to the students’ relative debt burdens. Because student debt tends to be increasing with the Gen Z cohort, the question of workload becomes increasingly important for two reasons. First, the workload of each class impacts performance and workload in other classes. Students may understandably seek classes that allow for more credits per semester and an earlier graduation. Similarly, workload affects their ability to work and offset expenses, i.e., reduce their debt exposure.
RESEARCH METHOD
Qualitative Research Results
After choosing CBC as the research method, the next step was to identify the most relevant attributes (i.e., instructional methods) and their corresponding levels of performance (options within each instructional method) (De Bekker-Grob et al., 2012). To determine the most relevant attributes and corresponding levels of performance, we reviewed the literature and conducted qualitative research (focus groups) with members of the population, undergraduate marketing students that were currently enrolled in a market research undergraduate course.
Before conducting the focus groups, the researchers developed an interview guide, with the goal of understanding the process of how undergraduate marketing students select their marketing classes as well as specific attributes driving their decisions. This qualitative approach started by building rapport followed by examining the process of marketing students selecting their classes (i.e., tell me about the process of selecting your classes?), along with those attributes driving their final decision (i.e., what are the important factors that you are looking for when selecting a class?). The researcher employed probing questions to gain a deeper understanding of participant responses (i.e., tell me more about that). The researcher conducted 3 focus groups with 6 to 8 participants in each group. While the focus groups started with structured questions, they were free flowing and unstructured in nature, allowing participants to discuss the topic from their perspective.
During and at the completion of the focus groups, the researcher employed open coding techniques borrowed from the grounded theory approach (Strauss & Corbin, 1990). During this process, the lead researcher conducted open coding along with negative case analysis, a critical analysis technique that attempts to provide evidence against a working hypothesis. This research process is known for generating results that are grounded in the qualitative data.
The qualitative results suggest that students generally have a limited number of choices for taking different marketing classes, and participants are typically comparing two different class alternatives. In some situations, the day and time a class is offered may limit the choice even more. For example, due to a student’s work schedule, the participant may not have a choice in the matter and be forced to select one option. With that said, in most instances, the participants were usually comparing two different class alternatives. In these situations, participants would often talk to their peers who have previously taken the different class alternatives as well as gather information from online resources such a ratemyprofessor.com.
When talking to their peers, participants would often discuss the following categories:
-
Professor related attributes such as personality, humor, and level of caring
-
Workload
-
Learning
-
Instructional methods utilized in the class
The overall purpose of this research article is to understand the importance of and preference for different instructional methods, while simultaneously focusing on aspects of instruction that are under the control of faculty. With this purpose in mind, the focus of the qualitative results will now center around different instructional methods. To be clear, part of the reasons the following instructional methods were so heavily discussed by participants is because many of the marketing faculty were currently employing these instructional methods. In addition, participants most often discussed these instructional methods in the choice process by their presence or absence. For example, participants in a focus group discussed comparing two class alternatives, with one class utilizing a flipped class hybrid approach, where in person class time was spent with student response systems, competition, and interactive sessions. In contrast, the competing alternative was mainly a traditional, lecture-based class with no student response systems and no competition. Thus, in the decision-making process, participants mainly focused on the presence or absence of an instructional method as opposed to varying levels of performance within these instructional methods.
As discussed, we reviewed the literature and conducted qualitative research with members of the population to determine the most relevant attributes and corresponding levels of performance. From these activities, we identified and defined the relevant attributes and levels driving behavioral intentions (choice) for this research study (see Figure 1). Given the qualitative results, some of the levels of performance for an attribute may either be the existence of the attribute or the absence of the attribute. For example, the class may implement competition or competitive games, or the class would avoid the use of competition or competitive games. For this study, the attributes and levels include the following:
-
How Class Time is Spent (Lecture vs. Interactive)
-
Flipped Classroom (Flipped vs. Not Flipped)
-
Workload (Average vs. Above Average)
-
Competition (Weekly Competitions vs. No Competitions)
-
Delivery Method (Face-to-Face vs. Hybrid)
-
Student Response System (SRS vs. No SRS)
Research Method: Choice Based Conjoint Analysis (CBC)
As stated earlier, DCA is the underlying theoretical foundation for this research study. To operationalize DCA, a choice-based conjoint analysis survey was delivered to a sample of marketing undergraduate students to explore their preferences for different instructional method. More specifically, two important research questions were examined:
-
What instructional methods (i.e., attributes) are most and least important to marketing undergraduate students?
-
For each instructional method, what is the preference for the different options (i.e., levels of performance) within each instructional method (i.e., attributes)?
We are informed by Dubas and Strong (1993), who employed conjoint analysis to account for student preferences in course design. While CBC has evolved dramatically since that study, its use to better understand student preferences is essentially unchanged. In a typical CBC survey question, study participants typically make a single choice from three or four competitive alternatives, and there are typically between 10 and 15 CBC questions (Garver et al., 2012; Orme, 2009). The competitive alternatives are comprised of relevant attributes and their corresponding levels of performance within each attribute (Dubas & Strong, 1993). To operationalize CBC in this study, instructional methods are synonymous with attributes, while the different options for each instructional method are synonymous with levels of performance within each attribute. For each CBC question, survey respondents choose the one competitive alternative they most prefer or would most likely choose (Orme, 2009). CBC is the most popular form of choice research methods (Garver et al., 2012), and the CBC program from Sawtooth Software was implemented to conduct this research study. More specifically, the web-based Discover academic application from Sawtooth Software was employed to collect and analyze the CBC data (Orme, 2018).
Before the actual CBC series of questions, the Discover application recommends asking for initial preferences for the various levels of performance (Orme, 2018). For example, for each of the levels, the question is, “Please rate the following features in how desirable they are to you,” and the answer choices are “undesirable,” “somewhat desirable,” “very desirable,” or “no opinion.” Research has shown that these pre-rating CBC questions produce more realistic choices for survey respondents, based on their unique preferences, thus delivering more accurate CBC results (Orme, 2018). A pre-rating CBC question was implemented for each level of each attribute.
The attributes and their corresponding levels described above were then entered into an experimental design within the Discover application, which created 11 CBC questions. Level balance, which is defined as having the same number of levels for each attribute, is important to reduce bias in CBC results (Orme, 2009). While it is common to include two to five levels of performance per attribute, given the nature of the attributes in this study as informed by our qualitative research, the researchers chose to employ level balance and to include only two levels of performance for each attribute. For each CBC question, we chose to include only two competitive alternatives. This was done because the sample of students typically choose between two classes (i.e., upper-level classes within their major) when registering for classes. Furthermore, given that the attributes include two levels, the resulting choices were more realistic with only two competitive alternative classes. Each question asked, "If these classes were your only options, which would you choose?
The experimental design created unique competitive alternatives for each choice. For example, one choice had the following competitive alternatives:
In each of the 11 CBC questions, the alternatives changed according to the experimental design plan. Sometimes the choice alternatives were close with only one or two differences in levels, and sometimes the choice alternatives were very different with four or more differences in levels.
Did Students in the Sample Understand the Different Instructional Methods?
The validity and reliability of this research study is based on the following question: Did students in the sample understand the different instructional methods offered in each CBC question? Yes. We come to this conclusion from by examining several different factors. Most importantly, each student in this sample had experience with both levels of each instructional method in the choice question. For example, a market research class (senior level course) was chosen to recruit the sample of marketing undergraduate students. Before entering this class, each student had experience with the different levels of each instructional methods in their undergraduate curriculum. Stemming from teaching and learning seminars offered by the College of Business, many professors from across the college as well as in the department of marketing implemented the different instructional methods. For example, marketing faculty were implementing flipped classrooms, hands-on interactive class sessions, competition, SRS, and hybrid formats. To further elaborate this point, the market research class which supplied the sample implemented the following instructional methods: a flipped classroom, hands-on interactive class sessions, competition, SRS, and a hybrid format.
The qualitative research results also provided evidence for a deep understanding of the different instructional methods. Based on student experience with the different instructional methods, qualitative research data suggested that students were very familiar with the different instructional methods. For example, qualitative data revealed that students could talk in-depth about the different instructional methods offered in prior classes they had taken, often discussing their preferences as well as their perceptions of learning from these different instructional methods. The qualitative data revealed that most students had experienced each instructional method at least three times before entering the market research class.
During the beginning of the CBC survey, the different instructional methods were defined for the CBC survey participants. On the following page of the survey, survey questions were implemented to ensure that survey participants had prior experience with the different instructional methods as well as properly understanding the different instructional methods. If they did NOT have experience with and did NOT correctly understand the different instructional methods, then they were later removed from the database and deemed a low-quality respondent.
After the initial survey was created, academic researchers and students from the target market were asked to provide feedback and to offer suggestions for improving the survey. After a few rounds of receiving feedback and making survey modifications, a draft of the survey was then tested on a convenience sample of marketing undergraduate students. After pre-testing the survey and having a high level of confidence with the survey, the final CBC survey was posted on a secure, password protected web site and administered to a sample of marketing undergraduate students.
Data Collection
The data collection process was undertaken over the duration of three academic semesters, or approximately a one-year time period. A market research marketing class (senior level course) was chosen to recruit the marketing undergraduate students, because each of the attributes (i.e., instructional methods) in this study were implemented in this class. Thus, each survey respondent has knowledge of and experience with each of the levels in this research study. Over the course of three academic semesters, students from three different sections of this market research course each semester were sent an email invitation to take the CBC survey. For complete survey responses, students were given five points of extra credit. Initially, 282 complete responses were collected from marketing undergraduate students. After data cleaning, a number of surveys were deemed to be low quality responses, as detected by a number of quality checks (i.e., time to take the survey, understanding attribute definitions, low consistency responses, and extreme responses) that were undertaken to ensure quality responses from the sample. The final sample consists of 251 complete and quality responses. Our analysis for non-response bias suggests that there were no significant differences between early and late respondents (Armstrong & Overton, 1977), more specifically in this study differences between earlier and later semesters.
Sample Characteristics
Each survey respondent in the sample was a full-time undergraduate student majoring in marketing, with 49% of the sample being a double major with both marketing and logistics. 89% of the sample was graduating one semester after the completion of this course, while 11% of the sample was graduating at the completion of this course. In addition, 48% of the sample were male, while 52% of the sample were female. The age range of the sample was from 20 to 25 years of age, yet almost 90% of the sample was between 21 to 23 years of age, providing evidence that the sample is part of Gen Z.
RESULTS: STATISTICAL ANALYSIS
The researchers employed Empirical Bayes to analyze the choice data within Sawtooth’s Discover web-based application, which provided attribute importance scores and preference scores for each of the corresponding levels of performance (Orme, 2018).
CBC Results: Importance of Attributes
When undergraduate marketing students are deciding which class to take next semester, what attributes are most important in driving that choice? Concerning the interpretation of attribute importance scores, the higher the score, the more important the attribute is to the decision. It is important to note that attribute importance scores are ratio level data that are relative to each other, and that a score of 20 can be interpreted as twice as important as a score of 10. Attribute importance scores sum to a total 100 points.
Examining Table 1, the researchers conclude that the three most important attributes are the flipped classroom (21.77), how class time is spent (21.08), and student work load (21.02). These three attributes have very similar attribute importance scores and account for almost 64% of the total importance. Competition in the classroom (13.67) is the fourth most important attribute, yet it is significantly less important than the top three attributes discussed prior. Class format (12.63) is the fifth most important attribute, while the least important attribute is SRS (9.57). All the attributes are important, yet they have varying levels of importance when influencing how students make choices on potential classes.
To test statistical significance of the importance score for each attribute, we employed one-sample t-tests. “Zero” was entered as the formal test coefficient in order to determine if each attribute importance was statistically significantly higher than zero. Each attribute importance score was significantly higher than zero (p value of .000), suggesting that each attribute is a statistically significant driver of choice (see Table 2).
To determine if statistically significant differences exist between the importance scores of different attributes, an overall within subjects F-test was conducted. Looking across the six attributes, results from the overall within subjects F-test (p value of .000) suggest that there are statistically significant differences between the six attributes. To determine specifically where these differences exist, we then employed paired samples t-tests on all possible pairs of attributes (see Table 3). The attribute, how classroom time is spent (interaction vs. lecture), is significantly more important than competition (p value of .000), class format (p value of .000), and SRS (p value of .000). In contrast, how classroom time is spent is not significantly more important than a flipped classroom (p value of .637) and student workload (p value of .971). The flipped classroom attribute is significantly more important than competition (p value of .000), class format (p value of .000), and SRS (p value of .000). In contrast, the flipped classroom attribute is not significantly more important than how class time is spent (p value of .637) and student workload (p value of .630). Likewise, student workload is significantly more important than competition (p value of .000), class format (p value of .000), and SRS (p value of .000). Student workload is not significantly more important than a flipped classroom (p value of .637) and classroom time is spent (p value of .971). Finally, SRS is the least important attribute and is significantly less important than all other attributes, including how class time is spent (p value of .000), student workload (p value of .000), the flipped classroom (p value of .000), competition (p value of .000), and class format (p value of .008). There is not a statistically significant difference in importance between competition and class format (p value of .305).
CBC Results: Preference Scores for Levels
Empirical Bayes was used to analyze the choice data, which resulted in preference scores for each of the corresponding levels of performance (Orme, 2018). Preference scores for the levels of performance are zero-based numbers, meaning that 0 represents average preference, while a positive preference score represents above average preference, and a negative preference score represents below average preference. Preference scores were calculated for each participant and the mean scores were calculated utilizing SPSS. Examining the results in Table 1, the preferences scores for the levels of performance lend insight into the preferences of marketing undergraduate students. Displaying well above average preference, marketing undergraduate students prefer the flipped class approach (58.43), where they watch video lectures before they come to class. Likewise, an interactive, hands-on classroom environment (58.34) also displays well above average preference. Simply put, students strongly prefer to be active learners during the classroom experience instead of being passive learners listening to an in-class lecture. Also displaying well above average preference is an average workload (58.86). Inversely, marketing students have well below average preference for an “above average workload.” All things being equal, marketing students do not want to work any harder in a class than they have to. Marketing students have above average preference for classrooms that incorporate competitive games or assignments on a weekly basis (24.81). While Gen Z marketing students are digital natives, our research findings show that they have above average preference for face-to-face (7.23) teaching styles. While there is a push to hybrid and online delivery platforms, marketing students prefer face-to-face teaching and learning environments. Finally, SRS (3.68) are preferred, yet the preference level is just slightly above average preference.
To determine if statistically significant differences exist between levels within an attribute, we employed paired samples t-tests (see Table 4). Given the nature of CBC data and preference results, it is not appropriate to compare preferences for different levels across different attributes (Orme, 2009). The results suggest that a flipped classroom, an interactive, hands-on classroom, an average workload, and weekly competitions are significantly more preferred than their alternative level (p value = .000). Face-to-face classes are significantly more preferred than hybrid classes (p value = .034). SRS is preferred to no SRS, yet this difference is not statistically significant (p value = .181).
To sum up marketing undergraduate student preferences for selecting a university marketing class, students have well above average preference for an interactive, hands-on class that utilizes the flipped classroom approach, while keeping the workload to a moderate level. These students have above preference for classes that incorporate daily and/or weekly competitive games and assignments. Afterall, they are marketing students who have chosen a major that operates in a highly competitive business environment. They have above average preference for face-to-face classes with a slight preference for SRS.
Segmentation Analysis – Latent Class Cluster Analysis
As discussed previously, identifying customer segments via their preferences for different instructional methods is a secondary purpose of this research study. To fulfill this purpose, Latent Gold 5.1 (latent class analysis software) was employed to analyze the data. The researchers used the random seed default in the program, implementing ten different starting points that were randomly selected. This helps to overcomes a potential drawback of models possessing a local solution and is considered best practice (Garver et al., 2008).
LCR Model Evaluation and Selection
The first task is to evaluate and identify the appropriate number of classes or segments via evaluating the model selection criteria (Wedel & DeSarbo, 1994). There are three typical criteria used to determine the appropriate number of segments, which include the goodness of fit, misclassification errors, and researcher judgement. Given the sample size of 251 observations along with practical considerations facing departments of marketing, we have limited the number of potential segments to four. Results for model evaluation and selection are included in Table 5.
The primary goodness of fit measure is the BIC, which accounts for parsimony, while simultaneously explaining model fit, whereas a lower BIC value is evidence for a better fitting model (Garver et al., 2008). The BIC value provides strong evidence that the 4-segment model (16025) is most appropriate.
Before examining misclassification errors, it is important to note that as the number of segments in the model increase, so do misclassification errors. For example, a 1-segment model will have no misclassification errors by definition. Thus, it is important to note the relative differences in misclassification errors as the number of segments increase. There is a large increase in misclassification errors as the model progresses from a 1-segment model (0) to a 2-segment model (.0752) as well as a relatively large increase from a 2-segment model to a 3-segment model (.1047). Examining the 4-segment model, there is a small increase from a 3-segment model to a 4-segment model (.1146). Examining misclassification errors lends strong support for a 4-segment model. After examining the statistical criteria to evaluate the appropriate number of segments, strong support exists for a 4-segment model. After examining the parameter estimates for all of segmentation models, researcher judgement confirms that the 4-segment model is most appropriate, delivering practical, interesting, and significant differences among the segments.
Below are the sizes of the four segments:
-
Segment 1 represents 33% of the sample
-
Segment 2 represents 31% of the sample
-
Segment 3 represents 25% of the sample
-
Segment 4 represents 11% of the sample
Segmentation Results
Each of the different segments have widely varying attribute scores as well as preference scores for different instructional methods (See Table 6 and 7). In this section, we will discuss attribute importance scores as well as the preferences for each segment. While some segments will have similar preference for different instructional methods (i.e., prefer an interactive, hands-on class), the strength of these preference will vary significantly from one segment to another.
Effective segmentation analysis delivers segments that have statistically significant differences on key variables (Garver et al., 2008). To test for statistically significant differences of importance and preference, we implemented ANOVA (See Table 6 and 7). Examining attribute importance scores for the different segments, the ANOVA results suggest that for each attribute, there are statistically significant differences of importance (p value < .001) among the segments (see Table 6). Examining preference scores for the different segments, the ANOVA results suggest that for each level (i.e., instructional method), there are statistically significant differences for preference (p value < .001) among the segments (see Table 7).
Our discussion will now turn to a description of each segment, with each segment being named for its distinctive characteristics. When comparing the segments, we will discuss differences between the segments utilizing results from ANOVA, more specifically Bonferroni post hoc tests utilizing an adjusted p value of .01
Segment 1 – Low Workloaders
Students in segment 1 place the most importance on workload (33.28), while the remaining attributes have similar attribute importance scores (11.79 to 14.49). Consistent with the importance scores for workload, an average workload (99.83) has significantly higher preference score than an above average workload. Students in segment 1 have preference for a flipped classroom, interactive, hands-on classroom environment, weekly competitions, face-to-face teaching, and NO SRS.
Segment 2 – Low Workloaders Who Flip & Interact
Students in segment 2 place the most importance on the flipped classroom (27.16), how class time is spent (24.91), and workload (33.28). Relative to segment 1, the importance of the flipped classroom (p value < .001) and how class time is spent (p value < .001) is significantly more important to segment 2, yet workload is significantly more important to segment 1 (p value < .001).
Students in segment 2 have preference for flipped classroom, interactive, hands-on classroom environment, an average workload, weekly competitions, face-to-face teaching, and SRS. Relative to segment 1, segment 2 displays much higher preference for the flipped classroom (p value < .001) and an interactive, hands-on classroom environment (p value < .001). While segment 2 prefers an average workload, their preference levels are significantly lower compared to segment 1 (p value < .001). Relative to Segment 1, Segment 2 has a similar preference for weekly competitions (p value = 1) and SRS (p value = 1), but much less preference for face-to-face delivery method (p value = .065).
Segment 3 – SRS Competitors
Students in segment 3 place the most importance on the flipped classroom (26.17), how class time is spent (23.18), and competition (22.22). Relative to segment 1 and 2, segment 3 places significantly more importance on competitions (p value < .001). Segment 3 places a similar level of importance on the flipped classroom (p value = 1) relative to segment 2, yet significantly more importance relative to segment 1 (p value < .001). Concerning how class time is spent, segment 3 places significantly more importance than segment 1 (p value = .002), yet similar importance relative to segment 2 (p value = 1).
Students in segment 3 have preference for flipped classroom, interactive, hands-on classroom environment, an average workload, weekly competitions, face-to-face teaching, and SRS. Relative to segment 1 and 2, segment 3 has significantly higher preference for weekly competitions (p value < .001 and p value< .001) and SRS (p value < .001 and p value = .003), and significantly lower preferences for an average workload (p value < .001). This segment is more tolerable for an above average workload, suggesting competitive students may be willing to work harder.
Segment 4 – Hybrid Interactors
Students in segment 4 place the most importance on how class time is spent (25.66), student response systems (19.97), and the flipped classroom (19.76). Segment 4 places significantly more importance on how class time is spent (p value = .004) relative to segment 1, yet similar importance relative to segment 2 (p value =1) and 3 (p value =1). Segment 4 places significantly more importance on SRS relative to segment 1 (p value = .012), segment 2 (p value < .001), and segment 3 (p value < .001). While the flipped classroom is important to segment 4, it is not significantly different than the other segments.
Students in this segment have preference for flipped classroom, interactive, hands-on classroom environment, an average workload, NO weekly competitions, hybrid teaching, and NO SRS. Different from other segments, Segment 4 is the only segment that prefers hybrid teaching and learning and these differences are significant for segments 1 and 3 (p value < .001 and p value = .046). Relative to other segments, segment 4 has the highest preference for interactive, hands-on classroom environment, yet this difference is only significant relative to segment 1 (p value < .002). Segment 4 has the highest preference for NO SRS, and this difference is significant relative to segment 3 (p value < .001). While segment 4 has preference for the flipped classroom, it is significantly less than segments 2 (p value < .001) and 3 (p value < .001), and very similar to that of segment 1 (p value =1).
DISCUSSION
The focus of this section is to examine both student preferences as well as learning effectiveness for the different instructional methods. The primary goal of any classroom experience should be to achieve high levels of student learning. We believe that the ideal class will achieve high levels of student learning while simultaneously meeting the preferences of students.
Within the research context, the preference results indicate that the key drivers of student choice for a class are an interactive, hands-on class, a flipped classroom approach, and a moderate workload. Students also significantly preferred face-to face classes over hybrids, the use of SRS and weekly competitions. These results are also consistent with our qualitative data and results. The biggest takeaway is the strong preference for an interactive classroom as well as a flipped classroom. It is important to note that all four segments have strong preference for an interactive, hands-on class and a flipped class, with some segments having extremely strong preferences for the two instructional methods. The important question now is, how are these instructional methods related to student learning?
Research suggests that interactive, hand-on classroom and the flipped classroom lead to higher levels of student learning (Dusengimana et al., 2023; Garver & Roberts, 2013; Iqbal, 2023; Ostapski et al., 2009; Rohm et al., 2019). For example, Barnett-Itzhaki et al. (2023) found that an interactive, hands-on classroom (i.e., active learning) led to higher perceptions of student learning. Dusengimana et al. (2023) conducted a systematic review of flipped classrooms and found evidence that a flipped classroom leads to higher levels of learning. Our qualitative data suggests that students perceive these methods as leading to higher levels of student learning. Research suggests that interactive, hand-on classroom and the flipped classroom are preferred by students and lead to higher levels of learning, a win-win for professors and students.
From an implementation perspective, an interactive, hand-on classroom and the flipped classroom are good complements to one another. During a flipped classroom, students experience the class content outside of class, so that class time can be spent doing active learning exercises. In this manner, a flipped classroom can facilitate a more interactive, hands-on approach for in-class sessions. Students prefer that course content and context be delivered outside of class and that in-class sessions be devoted to active learning exercises.
One barrier for faculty who might like to implement a flipped classroom that utilizes interactive, hands-on exercises in class is that these methods require a greater investment in time for faculty than the traditional lecture-based model. This is a considerable issue given most faculty are already time-pressured trying to meet research and service obligations, in addition to their teaching. The production of video to provide the foundation of course content requires a significant sunk cost in terms of faculty time, although this time utility can be partially recouped through re-use of the videos in subsequent semesters. Similarly, the method may also require the creation of accountability quizzes and assignments for every class session. This also has a high sunk cost of time initially, but these activities can also be reused or slightly modified in subsequent classes thereby offering some deferred time payback. However, the time spent grading all these interactive activities does not diminish much over time, other than some efficiencies gained from going down the learning curve.
This study also found that students prefer the use of weekly competitions and SRS. Three of four segments prefer weekly competitions, whereas one segment displays very strong preference for weekly competitions. SRS was preferred by students, yet there was not statistically significant difference between SRS and not using SRS. When examining segment preferences, one segment displays a strong preference for SRS, while one segment displays a strong preference for not utilizing SRS. Previous research studies have found evidence linking the use of games and competitions and SRS to higher levels of learning (Herrada et al., 2020). For example, Jaramillo-Mediavilla et al. (2024) found that games and competition motivated students which resulted in higher levels of student learning. Pena et al. (2024) found that semester long competitions significantly increased student learning. Kocak (2022) found that SRS provided a number of benefits (engagement, motivation, etc.) to students, with increased levels of student learning being the most importance outcome. Our qualitative data suggests that students perceive these methods as leading to higher levels of student learning. Research suggests that the use of games and competitions and SRS are preferred by most students and lead to higher levels of learning, another win-win for professors and students.
From an implementation perspective, the use of competitions and SRS are also good complements to one another. For example, Kahoot is a popular SRS platform and is designed around the concept of competition. In this manner, SRS may be a pedagogical tool to help implement competition in the classroom. Further supporting this point, segment 3 has a strong preference for weekly competitions and SRS, suggesting students who prefer to compete also prefer SRS. Some research on competition has highlighted its potential drawbacks, such as anxiety or low esteem for those students who do not perform well in the competition (Murray, 2019). Limiting student collaboration has been another criticism of competition, yet implementing team competitions may increase collaboration among students within their team (Murray, 2019). Teachers must design and implement competition in a manner that minimizes these potential drawbacks. Furthermore, the business environment is fiercely competitive. Implementing competition in the classroom may be one way to prepare marketing students for the business environment.
This study found that students prefer the use of face-to-face classes over hybrid classes. It is important to note that this finding may be inconsistent with the academic literature. Prior research in this area has demonstrated that students may prefer a hybrid classroom more than face-to-face classrooms (Baker et al., 2020). The preferences for face-to-face and hybrid classes in the study may be masked by the preferences of different segments. In our research findings, one segment had a strong preference for hybrid classes, while another segment had a strong preference for face-to-face classes. The academic literature presents mixed findings on whether face-to-face or hybrid classes lead to higher levels of student learning. For example, Little and Jones (2020) found that academic performance on different types of assignments varied between face-to-face and hybrid classes. For example, face-to-face students performed better on quizzes, while hybrid students performed better on exams and homework assignments. Likewise, Ahlin (2020) found that hybrid students outperformed face-to-face students in exam scores.
Based on mixed findings in the academic literature on student preferences and whether face-to-face or hybrid classes lead to higher student learning, implementation may be the most important factor. Successful implementation of either face-to-face or hybrid classes may lead to higher student satisfaction and preference for this approach as well as higher levels of student learning. With this in mind, we recommend that professors adhere to best practices in pedagogy for whatever method (face-to-face or hybrid) they choose to implement.
In this study, students displayed a strong preference for an average workload as compared to an above average workload. While three segments show a strong preference for an average workload, one segment has a low preference for an average workload that is not statistically significant from an above average workload. While it is intuitively appealing that an above average workload leads to higher levels of learning, the academic literature may suggest a different outcome. For example, research has demonstrated that an above workload may have a negative impact on student well-being, leading to student burnout, stress, and decreased motivation (Yangdon et al., 2021). In turn, these factors can lead to decreased levels of student learning and academic performance (Yangdon et al., 2021).
From an implementation perspective, it is important to find the right balance of workload no matter the instructional method. While the optimal amount of workload will challenge students and in turn, promote learning, too much workload may have a negative impact on student well-being, leading to student burnout, stress, and decreased motivation. In this manner, it is important to ensure that all classroom activities are high quality in nature that will lead to student learning.
Our research identifies student segments who have different preferences for instructional methods. Recognizing the different preferences of segments can help professors, departments, and colleges create different types of classes with different instructional methods to meet the preferences of their students. Student learning should always be a priority for course design, but where student learning associated with different instructional methods is mixed, student preferences should be a priority. For example, the academic research on learning suggests that there is a high level of learning in both face-to-face as well as hybrid classes, and our results suggest that some students have a strong preference for face-to-face classes while another segment of students will have a strong preference for hybrid classes. With this in mind, academic programs should consider offering both a hybrid and face-to-face version on their classes. Understanding the preferences of different segments along with student learning should help programs develop better portfolios of class offerings.
LIMITATIONS, FUTURE RESEARCH & FINAL CONCLUSIONS
As with any research, this study has research limitations. The sample is a convenience sample with one class from one university, thus it has limited generalizability to different types of classes across different types of universities. The sample of respondents all had knowledge of and experience with the instructional methods in this study, which is both a strength and weakness of the research study. Since students had experience with these instructional methods, they could form strong preferences from their experience. It is a weakness in that if this class and professor does a particular instructional method extremely well, then it could bias the results to the positive for that instructional method. If this class and professor does a particular instructional method poorly, then it could bias the results to the negative for that instructional method. Furthermore, this research study was limited to six instructional methods, a small sampling of what is currently available to faculty members.
Future research should be designed to overcome the stated research limitations. Thus, a more representative sample of the population of higher education marketing students is needed for future research. Preferably, a sample of higher education students from a number of universities across the country, covering a number of different disciplines. To examine more than six instructional methods in one study, future research should implement maximum difference scaling to gather student preferences of a larger number of instructional methods. Maximum difference scaling is a choice research methodology related to conjoint analysis, but able to include a much larger number of instructional methods in a single research study.
Funding
No funding was received for this article.
Disclosure Statement
The authors report there are no competing interests to declare.